

The Bollinger Bands indicator is a popular technical analysis tool that helps traders measure market volatility and identify potential trading opportunities. Whether you're trading Stocks, Nifty, or derivatives, understanding what Bollinger Bands are can help you analyse price movements more effectively.
In this guide, you’ll learn how Bollinger Bands work, how they are calculated, popular trading strategies, and how to apply them using Choice FinX.
What are Bollinger Bands?
The Bollinger Bands are a technical analysis indicator developed by John Bollinger in the 1980s. They consist of three lines plotted around a price chart that expand and contract based on market volatility.
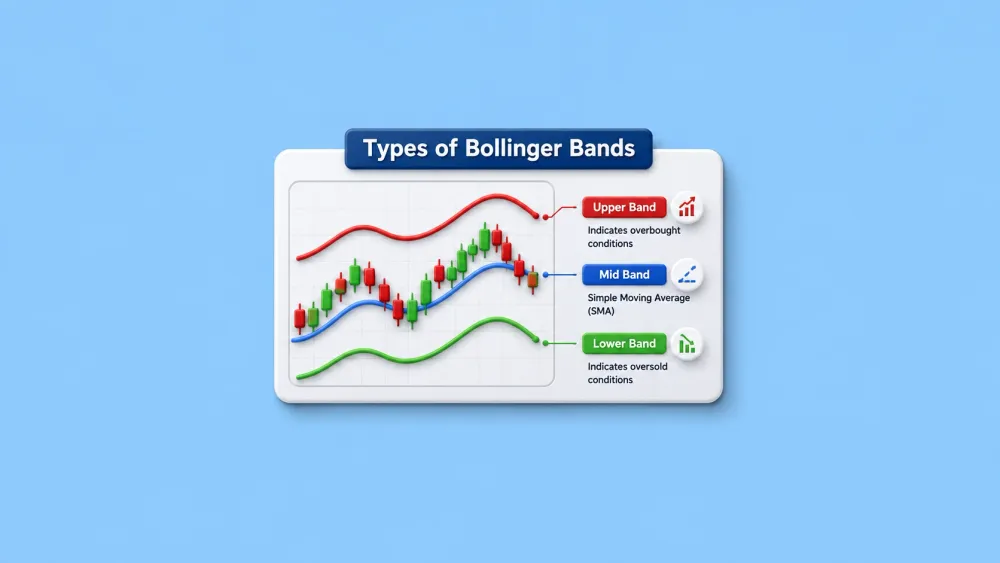
The three lines include:
- Middle Band – A 20-day Simple Moving Average (SMA)
- Upper Band – Two standard deviations above the moving average
- Lower Band – Two standard deviations below the moving average
The Bollinger Bands meaning is simple: when the market becomes more volatile, the bands widen. During low volatility, the bands narrow. This allows traders to identify periods of strong price movement or consolidation.
Understanding how Bollinger Bands work can help traders recognise possible trend reversals, breakout opportunities, and changing market conditions.
How are Bollinger Bands Calculated?
The Bollinger Bands indicator is calculated using a moving average and standard deviation, which measure how much prices move away from the average.
The calculation includes:
- Middle Band = 20-period Simple Moving Average (SMA)
- Upper Band = 20-period SMA + (2 × Standard Deviation)
- Lower Band = 20-period SMA − (2 × Standard Deviation)
Example
Suppose a stock has a 20-day average price of ₹500 and its standard deviation is ₹10.
- Middle Band = ₹500
- Upper Band = ₹520
- Lower Band = ₹480
If the stock price moves close to ₹520, it is trading near the upper band. If it approaches ₹480, it is near the lower band. These levels help traders understand whether the price is relatively high or low compared to recent price action.
The default Bollinger Bands settings are 20 periods and two standard deviations, and these settings are commonly used across different markets.
Types of Bollinger Bands
The indicator contains three bands, and each serves a different purpose.
Middle Band
The middle band is the 20-period Simple Moving Average. It represents the average price over the selected period and often acts as a dynamic support or resistance level.
Upper Band
The upper band indicates that prices are trading higher than the recent average. During a strong uptrend, prices may continue moving along the upper band instead of immidiately reversing.
Lower Band
The lower band shows that prices are trading below the recent average. In a downtrend, prices can remain close to the lower band for an extended period.
Instead of assuming prices will always reverse at the bands, traders should use additional confirmation before making trading decisions.
How to Use the Bollinger Band Indicator with Other Indicators?
Although the Bollinger Bands indicator provides useful insights into price volatility, it works better when combined with other technical indicators.
Some commonly used combinations include:
- RSI (Relative Strength Index): Helps identify whether a stock is overbought or oversold when it touches the upper or lower band.
- MACD: Confirms trend strength and potential changes in momentum.
- Volume Indicator: Higher trading volume during a breakout increases confidence in the price movement.
- Moving Averages: Helps identify the overall market trend before taking trades.
Using multiple indicators together can reduce false signals and improve trading decisions.
How to Apply Bollinger Bands Using Choice FinX?
Applying Bollinger Bands on Choice FinX is simple.
Follow these steps:
- Log in to your Choice FinX account.
- Open the chart of your preferred stock or Nifty index.
- Select the Indicators option.
- Search for Bollinger Bands.
- Apply the indicator with the default settings or customise them based on your trading strategy.
- Analyse price movement along with the upper, middle, and lower bands before making a trading decision.
Learning how to apply Bollinger Bands correctly can help traders analyse volatility more effectively.
How to Trade Using the Bollinger Band Trading Strategy?
There are several ways traders use the Bollinger Bands trading strategy, depending on market conditions.
1. Bollinger Band Squeeze Strategy
A Bollinger Band squeeze occurs when the bands become very narrow due to low market volatility. This often signals that a significant price movement may happen soon.
If the price breaks above the upper band with strong volume, it may indicate a bullish breakout. If it falls below the lower band, it could signal a bearish move. This setup is also known as a Bollinger Band squeeze breakout.
2. Bollinger Band Breakout Strategy
A Bollinger Band breakout happens when the price moves outside the upper or lower band. A breakout above the upper band may indicate strong buying momentum, while a breakout below the lower band may suggest increased selling pressure. Traders often wait for volume confirmation before entering a trade.
3. Trend Following Strategy
During strong trends, prices often move close to either the upper or lower band.
For example, while analysing Bollinger Band Nifty charts, traders may notice the index consistently trading near the upper band during bullish phases. Similarly, the Nifty Bollinger Band can remain near the lower band during prolonged downtrends.
This strategy helps traders trade in the direction of the prevailing trend instead of expecting immediate reversals.
Common Mistakes to Avoid
Many beginners misuse the Bollinger Bands strategy by relying only on the bands without considering the broader market trend.
Some common mistakes include:
- Assuming every touch of the upper or lower band means a reversal.
- Ignoring market volume during breakout trades.
- Using the indicator without confirming signals with RSI or MACD.
- Trading against the overall trend.
- Changing the default Bollinger Bands settings without proper testing.
Avoiding these mistakes can improve the effectiveness of trading using Bollinger Bands.
Conclusion
The Bollinger Bands indicator is a widely used technical analysis tool that helps traders measure market volatility and identify potential trading opportunities. While it can highlight possible breakouts, trend continuation, and periods of low volatility, it should not be used as the only basis for trading decisions.
Combining Bollinger Bands with indicators such as RSI, MACD, and volume analysis can provide better confirmation and improve trade accuracy. Before using any Bollinger Bands trading strategy, practice on historical charts and ensure it aligns with your trading style and risk management approach.
FAQs
What are the three lines in Bollinger Bands?
The three lines are the middle band (20-period Simple Moving Average), the upper band, and the lower band. Together, they help traders analyse price volatility and potential trading opportunities.
What do Bollinger Bands tell you?
They indicate whether market volatility is increasing or decreasing and help traders identify potential breakout, trend continuation, or reversal zones.
Which Bollinger Band is best?
There is no single best band. Traders use all three bands together to understand market conditions and make informed trading decisions.
What is the Bollinger Band Squeeze?
A Bollinger Band squeeze occurs when the upper and lower bands move closer together due to low volatility. It often signals that a strong price movement could occur after the consolidation phase.
Are Bollinger Bands suitable for options trading?
Yes. Many options traders use Bollinger Bands to identify volatility, breakout opportunities, and trend direction. However, the indicator should be used along with other technical analysis tools and proper risk management.
Which timeframes work best for Bollinger Bands?
Bollinger Bands can be used on multiple timeframes, including intraday, swing trading, and long-term investing. The ideal timeframe depends on your trading strategy and investment objectives.
Disclaimer: This article is for educational purposes only and should not be considered investment or trading advice. Always conduct your own research and consult a SEBI-registered financial advisor before making investment decisions.
Related Blog


Nifty Prediction For Tomorrow Indian equities witnessed a strong bullish session, with the Nifty closing at 22,997.35, up 374.65 points (+1.66%). The index opened higher by around 48 points from the previous close and touched an intraday low of 22,637.40 during the opening minutes, before witnessing a sharp upside rally. Strong buying momentum lifted the index to an intraday high of 23,056.40, followed by mild profit booking before it closed at 22,997.35. The session reflected a notable improve
14 October 2026
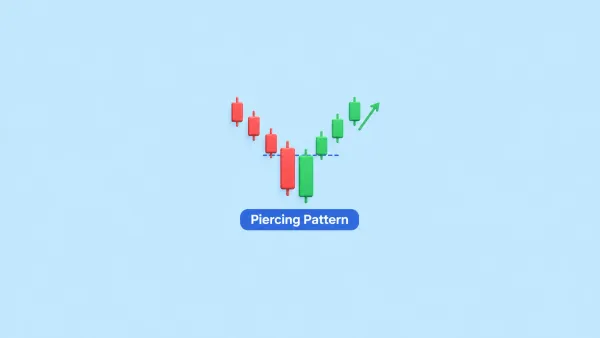
Understanding candlestick patterns can help traders study price movements and identify possible changes in market direction. One such pattern is the Piercing Pattern, which may signal a shift from selling pressure to buying pressure after a price decline. The pattern consists of two candles and is commonly used in technical analysis to identify a possible bullish reversal. However, it does not guarantee that prices will rise. Traders usually look for confirmation from the following candles, tr
14 October 2026

Key Takeaways * An ETF holds a basket of securities and trades on a stock exchange like a share. * Most ETFs in India are passively managed — they aim to copy an index, a commodity like gold or another benchmark, rather than try to beat it. * Returns can differ a little from the benchmark, because of expenses, cash holdings, transaction costs, portfolio adjustments and the fund’s replication method. * You need a demat and trading account to buy and sell ETF units. * ETFs are generally low-
13 October 2026
Made for Traders.
Trusted by Investors.
Download FinX — trade confidently, invest
smarter, track everything.

Table of Contents
