

Understanding candlestick patterns can help traders study price movements and identify possible changes in market direction. One such pattern is the Piercing Pattern, which may signal a shift from selling pressure to buying pressure after a price decline.
The pattern consists of two candles and is commonly used in technical analysis to identify a possible bullish reversal. However, it does not guarantee that prices will rise. Traders usually look for confirmation from the following candles, trading volume and the overall market trend before making a decision.
Key Takeaways
- Piercing Pattern is a two-candle pattern that may signal a bullish reversal after a downtrend.
- Consists of a bearish candle followed by a bullish candle that closes above the midpoint of the previous candle's body.
- Generally more meaningful when it forms near a support level after a sustained price decline.
- Traders often look for confirmation through the next candle, trading volume or other technical indicators.
- Like other candlestick patterns, it can produce false signals and should not be used alone to make trading decisions.
What Is the Piercing Pattern?
The Piercing Pattern is a bullish reversal candlestick pattern that forms after a price decline. It consists of a large bearish candle followed by a bullish candle that opens below the previous candle's close and closes above the midpoint of its body.
This formation suggests that buyers are gaining strength after sellers have been in control, although a reversal is not guaranteed.
Anatomy of the Piercing Line Pattern
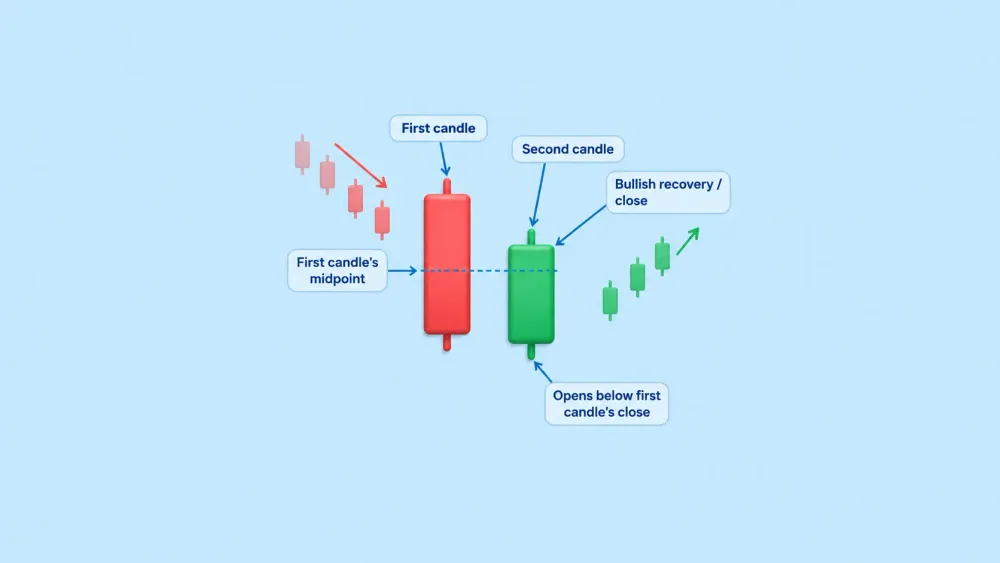
The Piercing Line Pattern has two main candles:
- First candle: A bearish candle that shows selling pressure, with the closing price below the opening price.
- Second candle: A bullish candle that opens below the first candle's close but rises to close above the midpoint of the first candle's body.
The second candle's strong recovery is the key feature. If it closes above the midpoint but remains below the first candle's opening price, the formation may qualify as a Piercing Pattern.
How Does the Piercing Pattern Work?
The Piercing Pattern shows a possible change in market sentiment after a price decline. The first candle indicates that sellers are in control, while the second candle shows buyers pushing the price higher.
When the second candle closes above the midpoint of the first candle's body, it suggests that buyers have recovered a significant part of the previous session's losses. Traders may interpret this as an early sign that the downtrend could weaken.
However, the pattern is more useful when it appears after a clear decline and near a support level. If the price continues to fall after the pattern forms, the expected reversal may not happen.
Formation of the Piercing Candlestick Pattern
A Piercing Pattern forms when two candles meet specific conditions.
- A downtrend is already in place: The stock's price has been moving downward, showing that sellers have been stronger.
- The first candle is bearish: A red candle forms, with its closing price below its opening price.
- The second candle is bullish: The next candle opens below the previous candle's close and then moves upward.
- The second candle closes above the midpoint: Its closing price rises above the halfway point of the first candle's body but remains below the first candle's opening price.
When these conditions are met, the formation may be identified as a Piercing Pattern.
How to Use a Piercing Candlestick Pattern in Trading?
Traders can use the Piercing Pattern as one part of their trading analysis. Here are some common steps to consider:
- Identify the downtrend: Look for the pattern after a sustained price decline rather than during a sideways market.
- Check the support level: A pattern near a support area may carry more significance because buyers could be stepping in at that price.
- Wait for confirmation: Observe whether the next candle continues upward or whether the price falls again.
- Check trading volume: Higher volume during the bullish candle may provide additional evidence of buying interest.
- Plan risk management: Traders should decide their entry, exit and stop-loss levels based on their strategy and risk tolerance rather than relying on the pattern alone.
A Piercing Pattern can help traders identify a possible opportunity, but it should not be treated as a standalone buy signal.
Advantages and Disadvantages of the Piercing Pattern
| Advantages | Disadvantages |
|---|---|
| Easy to identify once the two-candle structure is understood. | Can produce false reversal signals. |
| May help identify a possible change from selling pressure to buying pressure. | Works less reliably without a clear preceding downtrend. |
| Can be combined with support levels and trading volume. | May require additional confirmation before a trading decision. |
| Can be applied to different chart timeframes. | The pattern alone does not indicate how far the price may rise. |
Example of a Piercing Candlestick Pattern in a Live Stock
You can use the charting feature available on the Choice FinX platform to study candlestick patterns in individual stocks. The platform offers chart intervals and chart types, allowing users to examine price movements.
To identify a Piercing Pattern, open a stock chart and look for a bearish candle followed by a bullish candle that closes above the midpoint of the previous candle's body. Check whether the pattern appears after a downtrend and look for confirmation from subsequent price movements.
Consider a hypothetical example using a stock trading at ₹100 before a decline.
- Day 1: The stock opens at ₹100 and closes at ₹90, forming a bearish candle.
- Day 2: The stock opens at ₹88, showing continued selling pressure initially, but buyers push it up to close at ₹96.
- Midpoint check: The midpoint of the first candle's body is ₹95. Since the second candle closes at ₹96, above this midpoint but below the first candle's opening price of ₹100, the two candles form a Piercing Pattern.
This formation may indicate that buying pressure is increasing. If the next session shows further upward movement and other signals support the setup, traders may consider the possibility of a bullish reversal.
Conclusion
The Piercing Pattern is a two-candle formation that traders use to identify a possible bullish reversal after a price decline. Its main feature is the second bullish candle closing above the midpoint of the previous bearish candle's body.
While the pattern can help traders understand changing market sentiment, it should not be used as a standalone trading signal. Checking the broader trend, volume, support levels and confirmation from subsequent price action can provide a more complete picture. Combining a Candlestick pattern with careful risk management can help traders make more informed decisions when trading stocks.
FAQs
What is a piercing line?
A Piercing Line is a two-candle candlestick pattern that appears after a downtrend. It consists of a bearish candle followed by a bullish candle that closes above the midpoint of the previous bearish candle's body.
Is the piercing line bullish or bearish?
The Piercing Line is a bullish reversal pattern because it may indicate that buyers are gaining strength after a price decline. However, it does not guarantee that the price will rise.
How do I confirm the piercing pattern?
Traders can look for a subsequent bullish candle, higher trading volume and support from other technical indicators or support levels. No single confirmation method guarantees that the reversal will succeed.
Related Blog


Key Takeaways * An ETF holds a basket of securities and trades on a stock exchange like a share. * Most ETFs in India are passively managed — they aim to copy an index, a commodity like gold or another benchmark, rather than try to beat it. * Returns can differ a little from the benchmark, because of expenses, cash holdings, transaction costs, portfolio adjustments and the fund’s replication method. * You need a demat and trading account to buy and sell ETF units. * ETFs are generally low-
13 October 2026

Nifty Prediction For Tomorrow Nifty closed at 22,363.35, down 157.10 points (-0.70%). The index opened higher at 22,593.20, around 72 points above the previous close, and initially touched an intraday high of 22,651.10. However, selling pressure emerged soon after the opening and persisted through most of the session. Nifty declined to an intraday low of 22,304.45 before recovering slightly to close at 22,363.35, reflecting continued weakness and a lack of sustained buying interest at higher le
11 October 2026
Made for Traders.
Trusted by Investors.
Download FinX — trade confidently, invest
smarter, track everything.

