
In the world of trading and investing, visual tools play a critical role in analysing market movements. One of the most commonly used tools among traders is the candlestick charts, which offer detailed insights into price action over time. By combining data on open, close, high, and low prices, candlesticks help market participants make more informed decisions.
Whether you’re just entering the stock market or looking to sharpen your technical analysis skills, learning how to interpret these charts can be invaluable. To make your learning easier, we’ve also prepared a comprehensive candlestick patterns PDF that you can download and keep as a handy reference.
Download the Candlestick Patterns PDF - Candlestick Patterns PDF
In this article, we explore all types of candlestick patterns to help traders make more informed decisions.
Bullish Candlestick Patterns
Bullish candlestick patterns typically appear after a downtrend or during consolidation, signalling a possible price reversal to the upside. Here are commonly used bullish patterns:
Piercing Line Candlestick Pattern
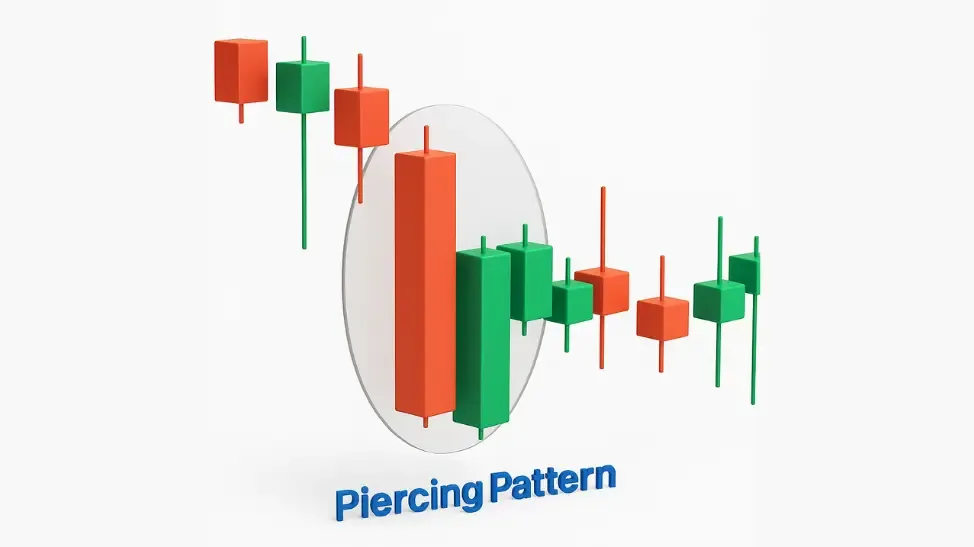
The Piercing Line is a two-candle pattern:
- The first is a bearish candle.
- The second is a bullish candle that opens lower but closes above the midpoint of the first candle.
What It Means: This formation reflects a potential reversal. Buyers are regaining control and pushing prices higher after a period of selling.
Bullish Engulfing Candlestick Pattern
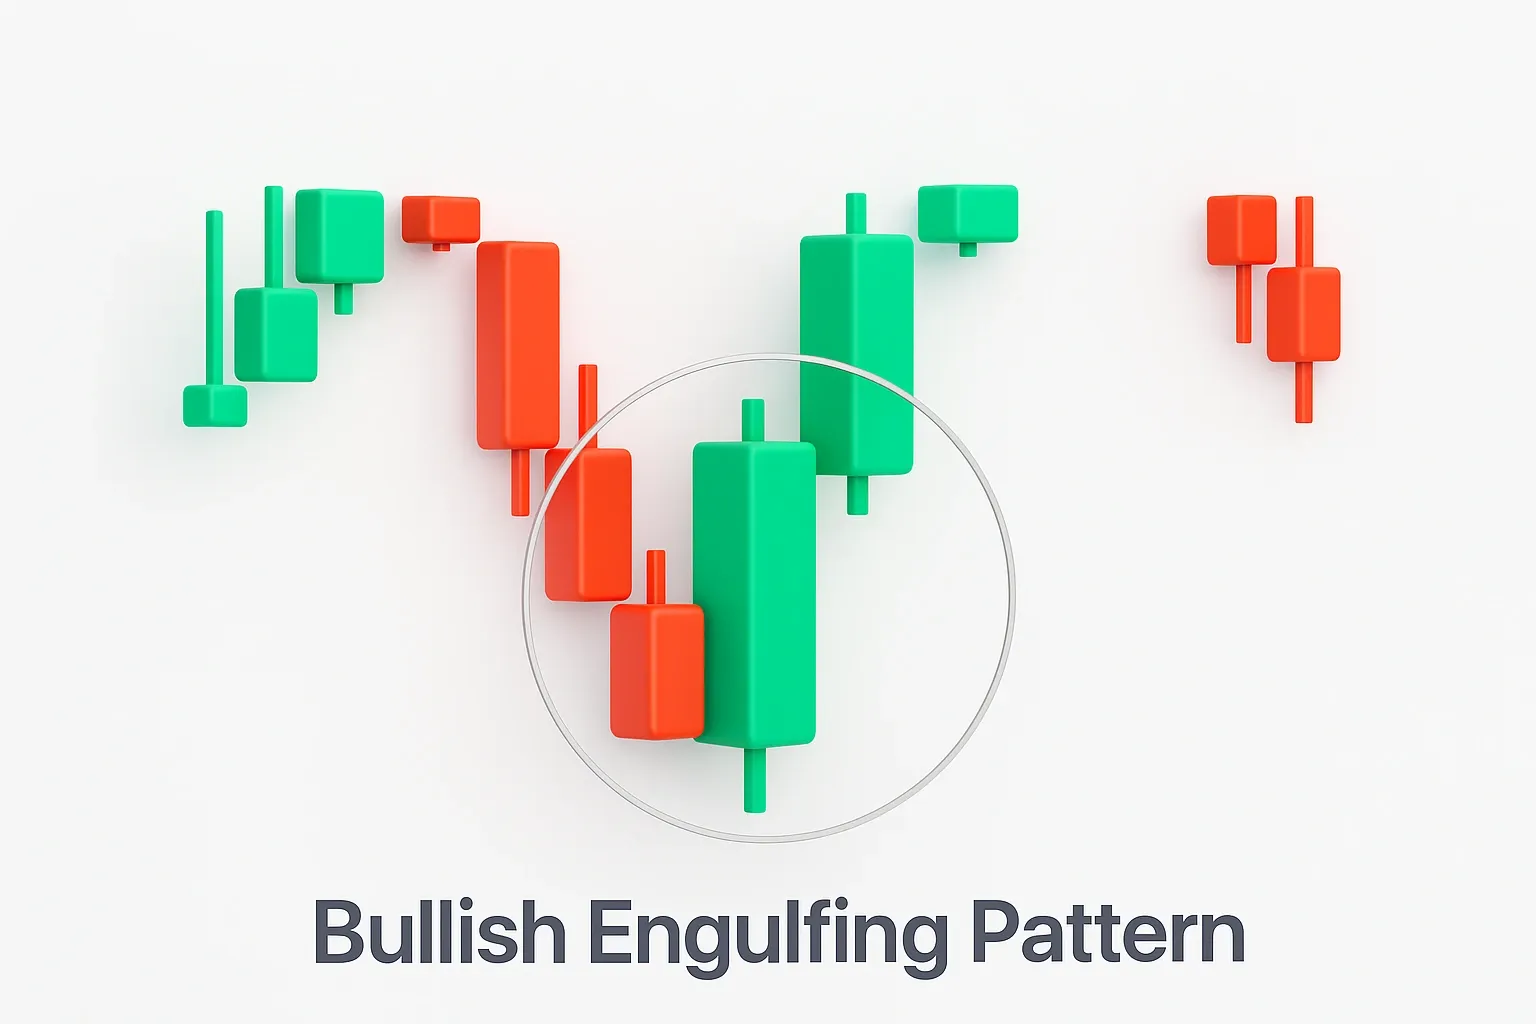
Bullish Engulfing candlestick pattern formation consists of two candles and generally indicates a powerful shift upwards in a downward-trending market.
- It begins with a small red (bearish) candle, showing continued selling pressure.
- This is followed by a larger green (bullish) candle that opens lower but closes significantly higher, fully wrapping around the body of the previous candle.
What It Means: This pattern highlights a shift in control from sellers to buyers, suggesting rising optimism and the start of an upward move.
Hammer Candlestick Pattern:
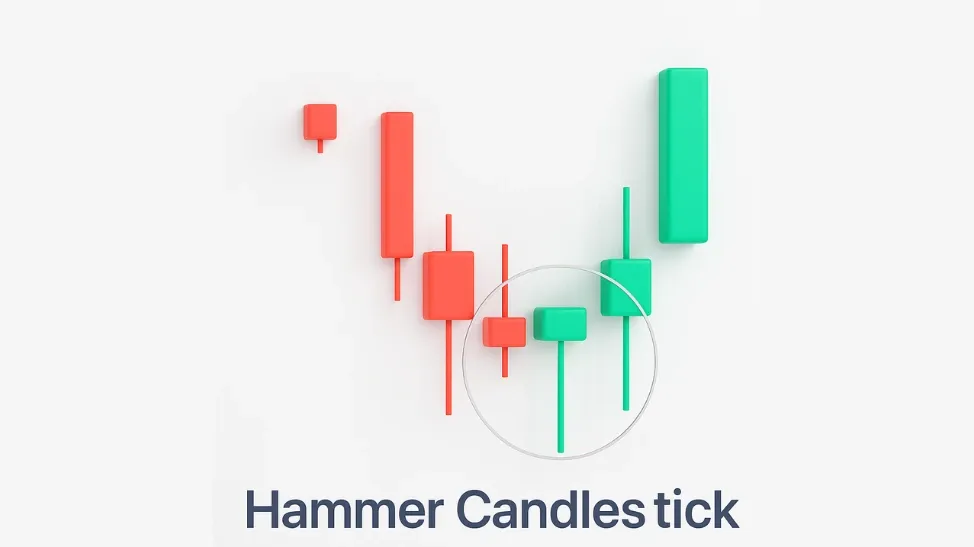
After a market drop, a Bullish Hammer candlestick pattern forms as a noticeable one-candle pattern.
- At the top of the candle, there's a small, tightly formed section.
- Accompanied by a lengthy lower wick, signifying that although prices decreased during the trading period, they experienced a robust recovery.
What It Means: It reflects renewed buying interest. After initial selling pressure, buyers stepped in, hinting at a potential price bounce.
Morning Star Pattern:
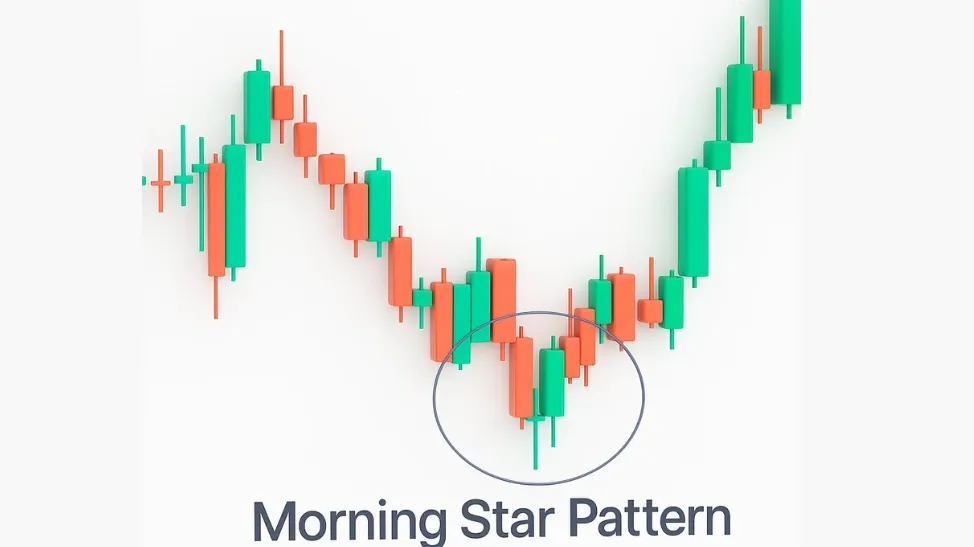
Composed of three candles, the Morning Star Candlestick pattern usually emerges after a market downturn.
- A large red candle (showing strong selling),
- A small-bodied candle (indicating market indecision),
- A strong green candle (suggesting buyers are taking over).
What It Means: This pattern shows fading bearish momentum followed by a resurgence of buying strength, a clear bullish reversal signal.
White Soldiers Pattern:
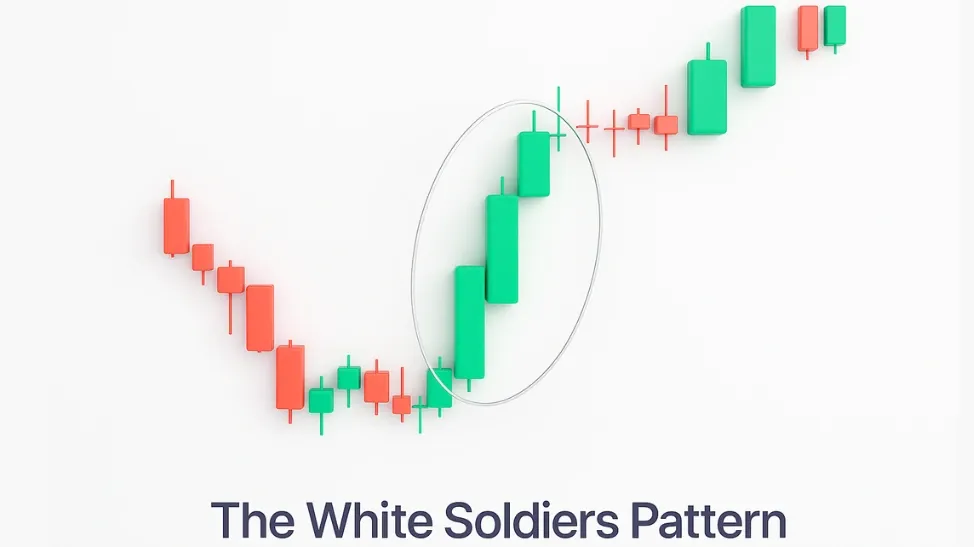
The three white soldiers candlestick pattern includes three consecutive green candles, each closing higher than the last and with little or no shadows.
- Every candle opens at a price point close to or within the range of the preceding candle's body, indicating consistent buying pressure.
What It Means: A strong signal of market recovery and the establishment of a bullish trend.
Dragonfly Doji Candlestick Pattern:
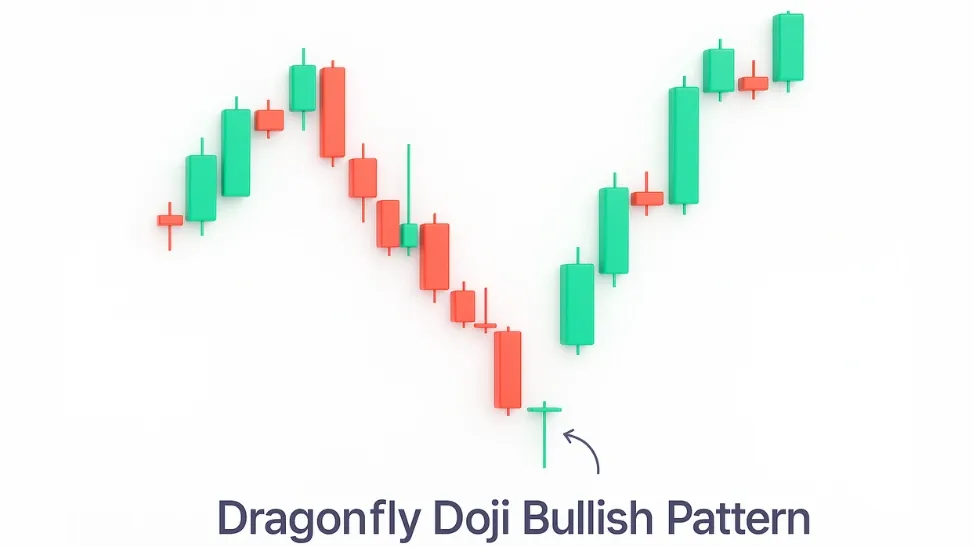
You'll recognise a Dragonfly Doji Pattern is a single candlestick pattern because its open, close, and high are virtually the same, and it features a significantly lower shadow.
- Appears at the bottom of a downtrend.
What It Means: Suggests a potential bullish reversal as it shows sellers were initially in control, but buyers regained strength before the close. Unlike the Hammer, it lacks a body, showing complete indecision at the turning point.
Harami Pattern:
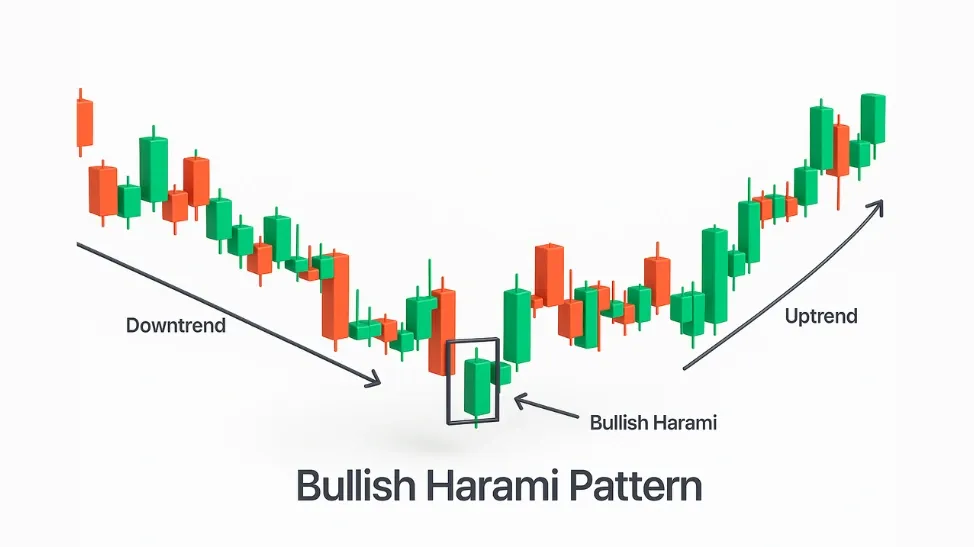
Bullish Harami Candlestick Pattern is a , a small green candle fits entirely within the body of a larger red candle that precedes it.
- The pattern indicates a loss of bearish strength.
What It Means: The reduced selling activity and smaller trading range suggest possible consolidation or reversal to the upside.
Inverted Hammer Candlestick Pattern:
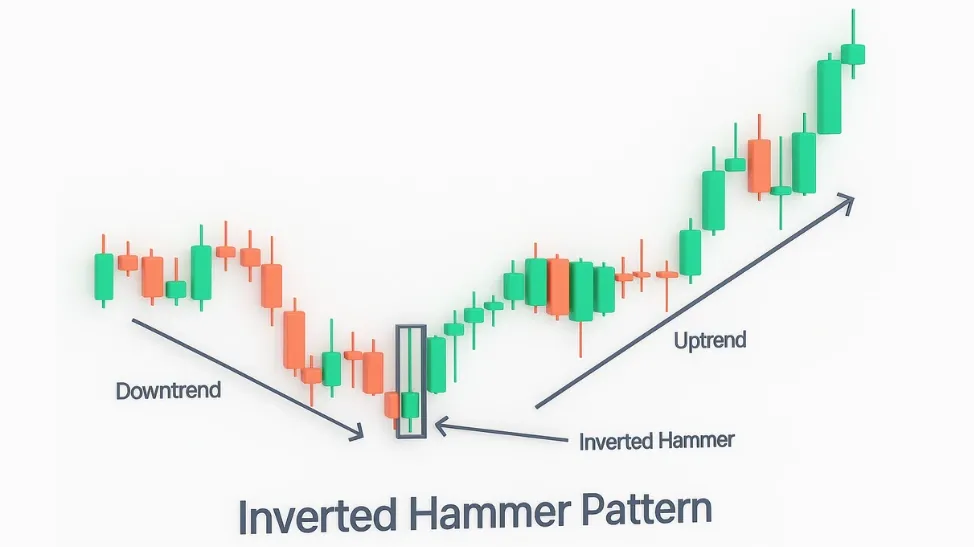
Following a decline in the market, the inverted hammer pattern emerges and is characterised by:
- A compact real body situated at its lower end.
- A lengthy upper shadow, coupled with a minimal or absent lower shadow.
What It Means: It reflects an unsuccessful attempt by sellers to push prices lower, with buyers stepping in. This can signal the start of a reversal.
Three Outside Up Candlestick Pattern:
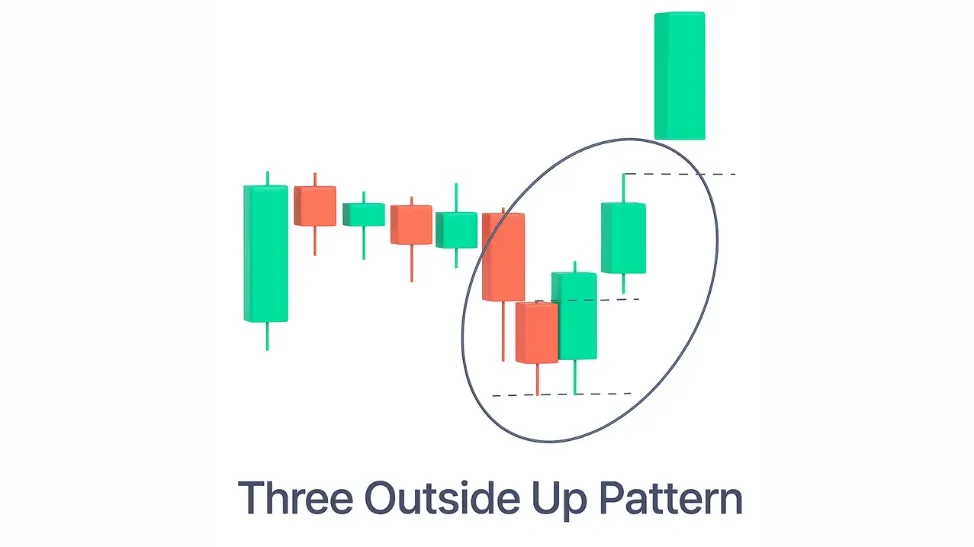
This three-outside-up pattern features three candles:
- A bearish candle to start.
- A bullish candle that completely engulfs the first.
- A third bullish candle then appears, solidifying the reversal by closing above the second candle's close.
What It Means: It validates a bullish reversal with confirmation through continued buying strength.
Three Inside Up Candlestick Pattern:
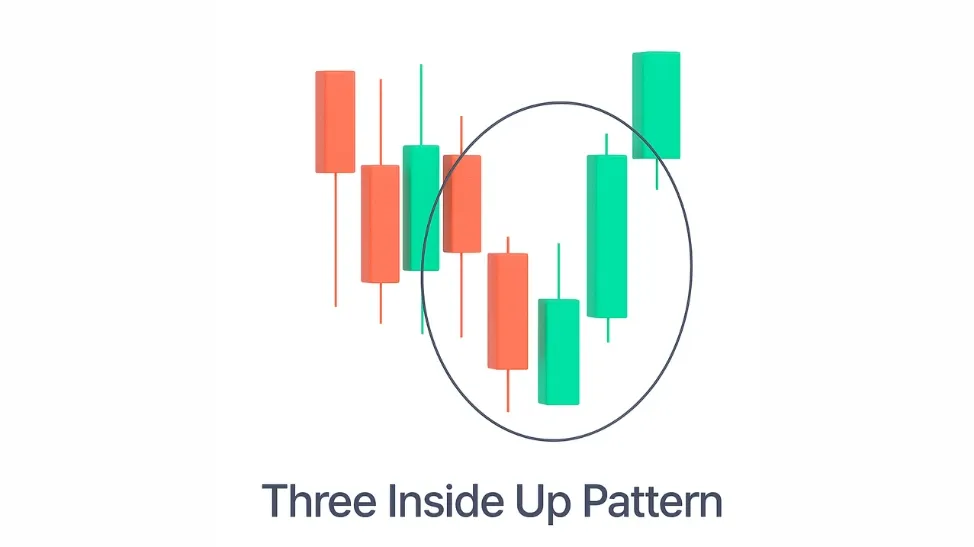
The Three inside up pattern includes:
- A long red candle.
- A smaller green candle that closes past halfway of the first,
- Followed by a second green candle that finishes above the opening price of the initial candle.
What It Means: This structure shows weakening bearish momentum and a growing bullish presence, pointing to a potential trend reversal.
Abandoned Baby Pattern:
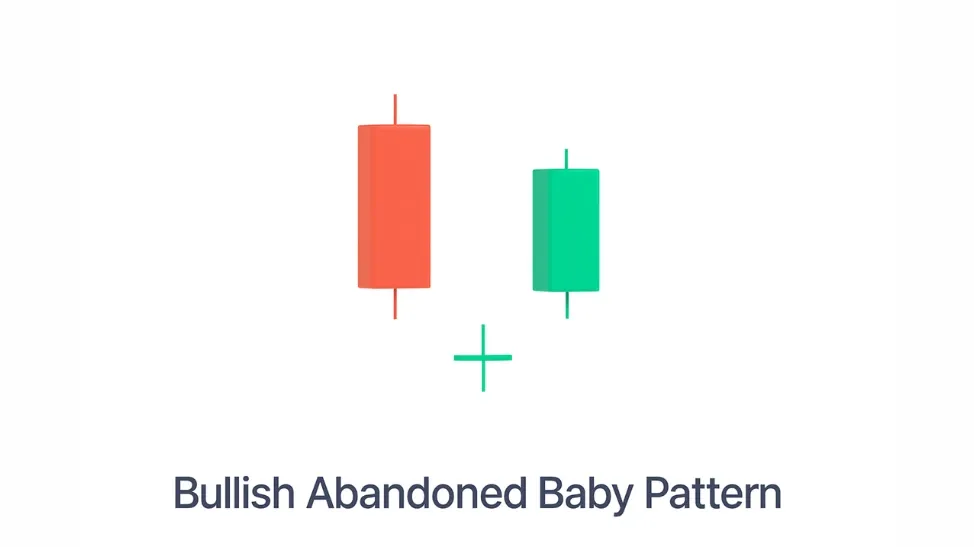
This is a rare but strong three-candle pattern:
- A long bearish candle.
- A doji that gaps down (isolated from both previous and next candles).
- A long bullish candle that gaps up.
What It Means: This pattern shows a complete shift in sentiment, indicating the end of a downtrend and the beginning of a bullish move.
Bullish Kicker Candlestick Pattern:
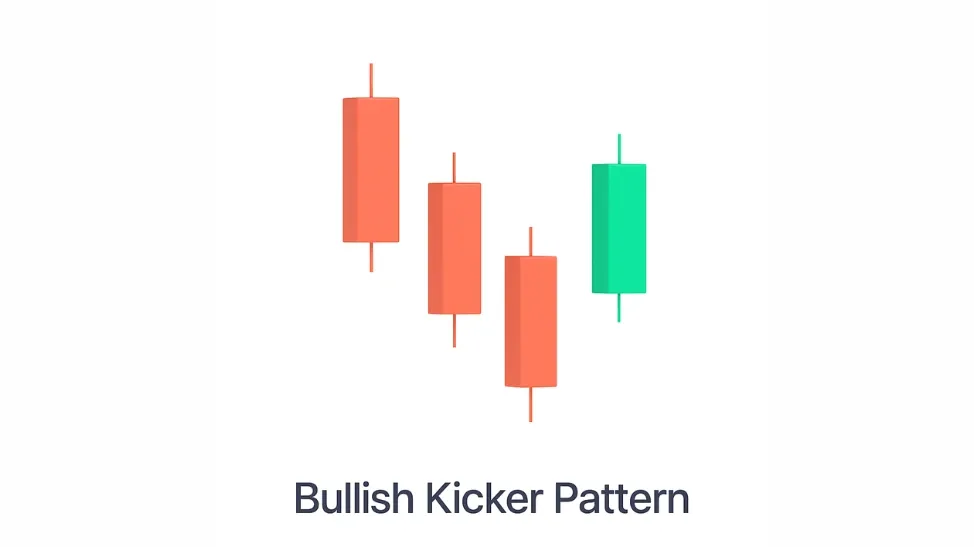
The Bullish Kicker pattern involves two candles:
- The pattern begins with a strong downward candle, followed by an aggressive bullish candle that gaps up significantly above the previous close and continues its upward surge
What It Signifies: This pattern shows a dramatic change in market direction, where bullish momentum suddenly overwhelms prior selling pressure, indicating a possible major trend reversal.
Rising Three Methods Pattern:
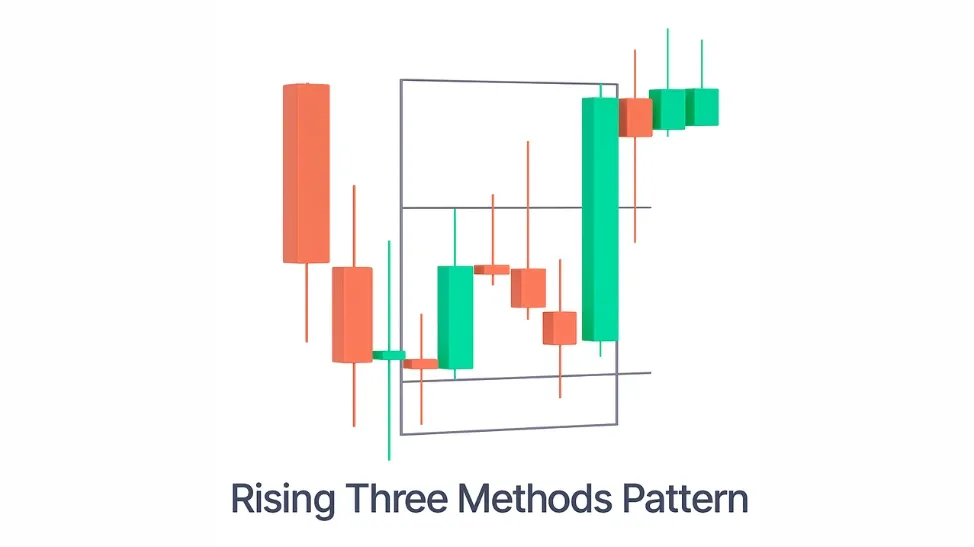
This five-candle formation includes:
- An initial elongated upward-trending candle.
- Followed by three diminutive bearish candles, all of which remain confined within the high-to-low price range of the first candle.
- Concluding with another substantial bullish candle that finishes above the peak price of the initial one.
What It Signifies: This sequence suggests a short period of market stabilisation within an ongoing upward trend. Despite a minor price pullback, buying power remains dominant, indicating the probable continuation of the upward trajectory.
Tweezer Bottom Pattern:
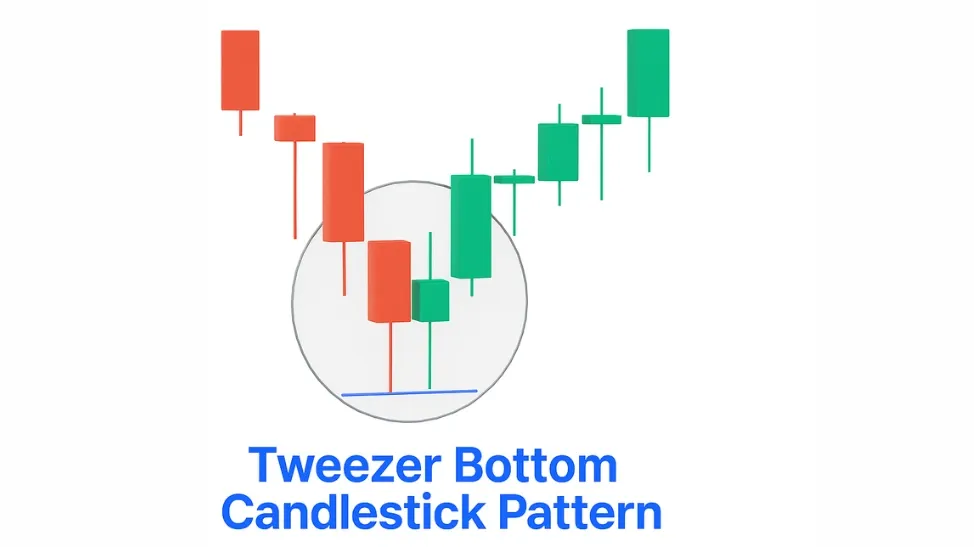
In a Tweezer Bottom, two candles appear side-by-side: one bearish and one bullish, often of similar size and sharing the same or nearly identical low points.
What It Signifies: This formation typically marks a support zone, where buyers are stepping in to prevent further decline.
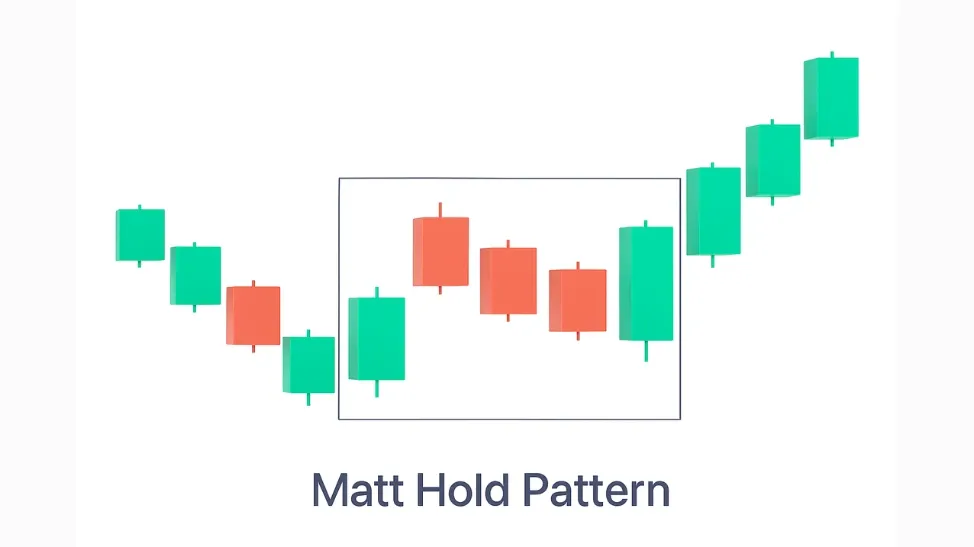
Mat Hold Pattern:
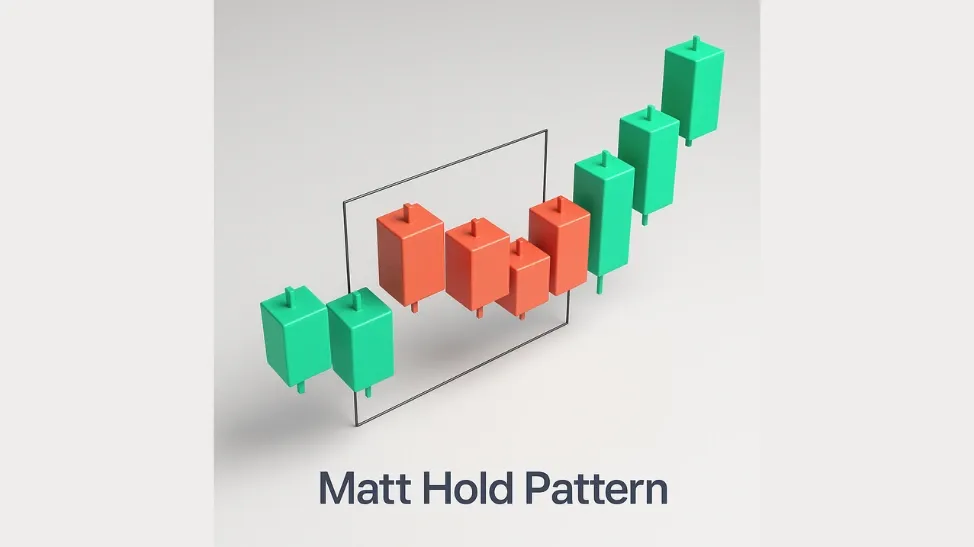
Similar to the Rising Three Methods, the Mat Hold has five candles:
- A strong bullish candle.
- Within the boundaries set by the first candle, three smaller bearish candles appear.
- A bullish candle that closes higher than the first candle’s high.
What It Signifies: Suggests a healthy pause or consolidation within a larger uptrend, reaffirming continued buyer strength.
Concealing Baby Swallow Pattern:
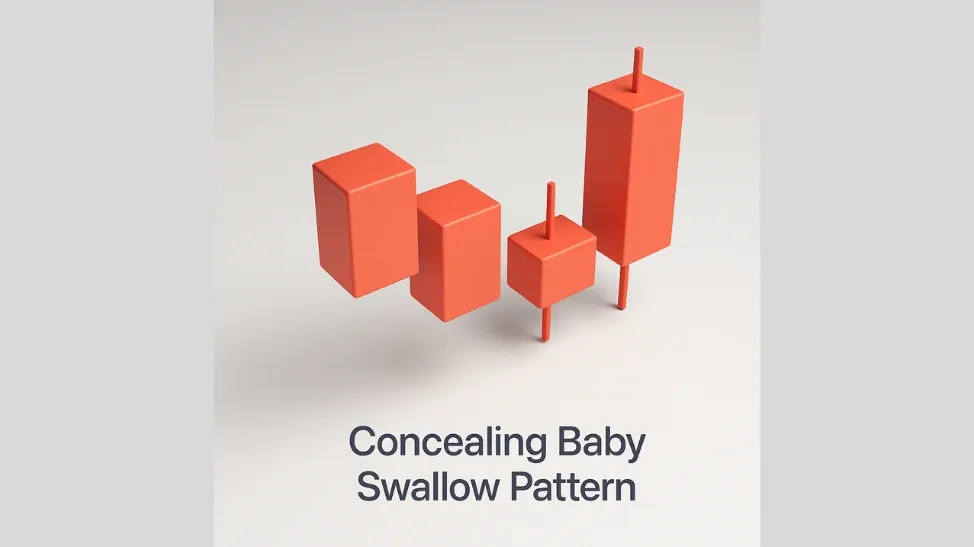
This rare four-candle pattern features:
- Initially, two extended candles indicate a price decline.
- Following that, a small candle emerges, opening beneath the prior close, and its direction (bearish or bullish) doesn't matter.
- Lastly, a subsequent bearish candle emerges, completely engulfing the preceding small candle's body.
What It Signifies: Even in a downtrend, the inability of the bears to maintain dominance may indicate fading selling pressure. A reversal to the upside could be near.
Bullish Separating Lines Pattern:
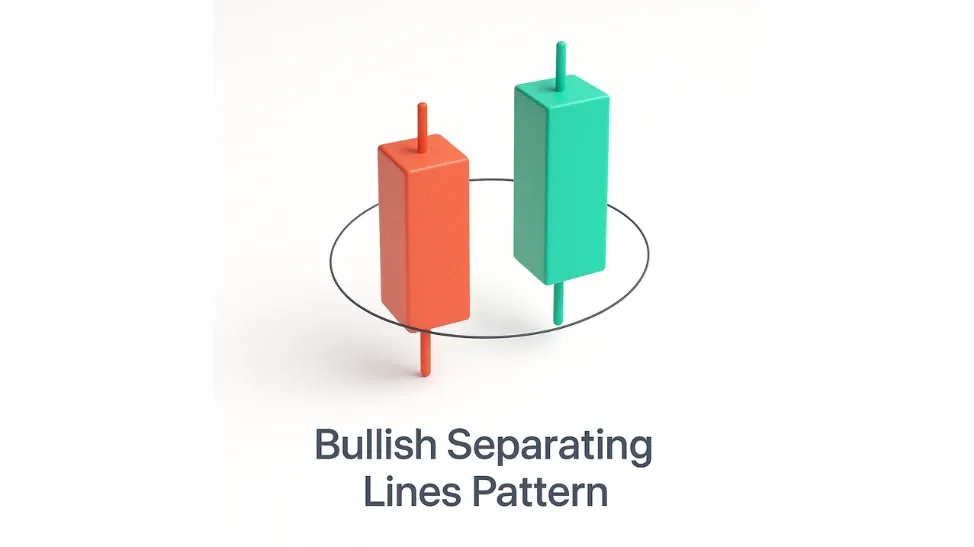
The setup involves two candles: first, a bearish one, immediately followed by a bullish candle. Notably, the bullish candle's opening price matches the bearish candle's open, and it then closes at a higher level.
What It Signifies: The uptrend resumes immediately after a minor pullback, indicating a strong bullish continuation.
Three-Line Strike Candlestick Pattern:
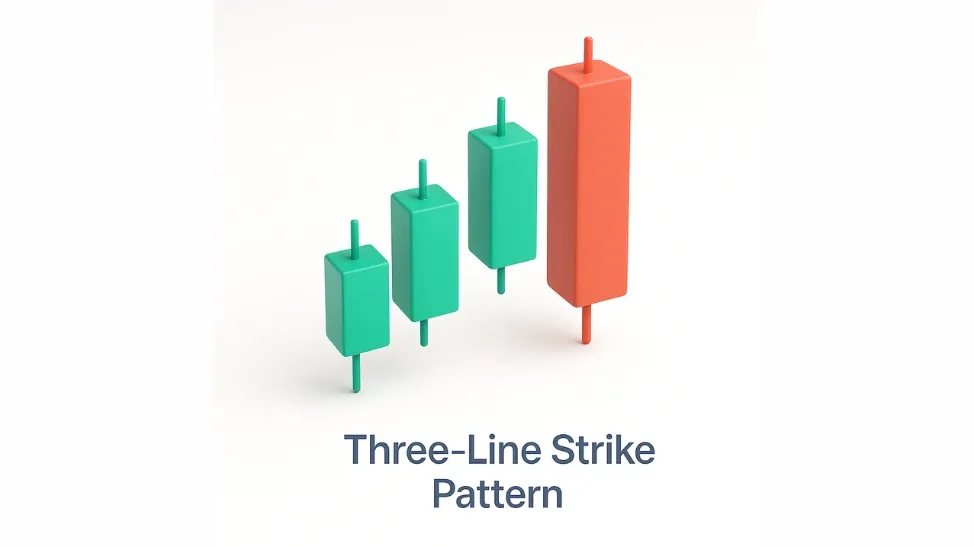
This four-candle formation includes:
- Three consecutive bullish candles forming higher highs.
- The fourth candle is also bearish; it starts at a higher price point but ultimately settles below the initial candle's low.
What It Signifies: Despite the sharp pullback on the fourth candle, the bullish momentum is expected to resume, making this a deceptive yet optimistic signal.
Bullish Belt Hold Pattern:
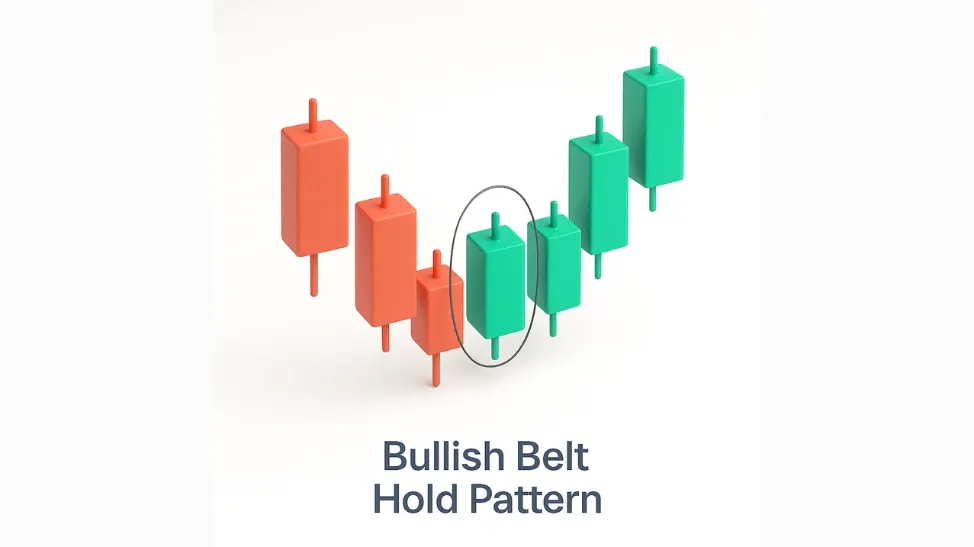
The Belt Hold is a single bullish candle that opens low in a downtrend but pushes higher throughout the session, closing near its peak with little or no lower wick.
What It Signifies: A sudden surge in buying interest, which may lead to a trend reversal or the start of an upward move.
Bullish Meeting Lines Candlestick Pattern:
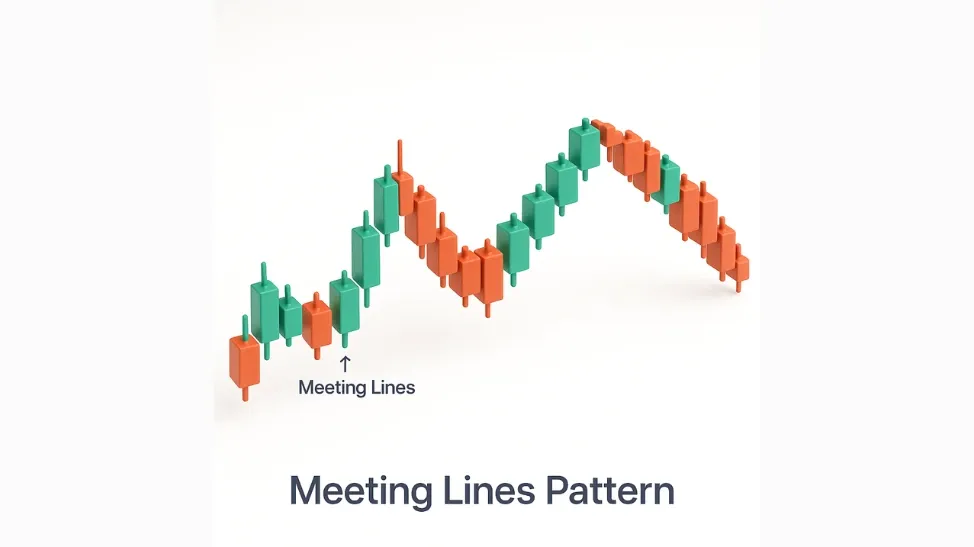
This pattern consists of two candles:
- A long bearish candle.
- Next, a bullish candle forms, opening below the previous close yet finishing its trading session at essentially the same price as the preceding bearish candle's close.
What It Signifies: A change in market sentiment. Buyers stepping in to match the previous day’s losses could signal a reversal in direction.
Ladder Bottom Pattern:
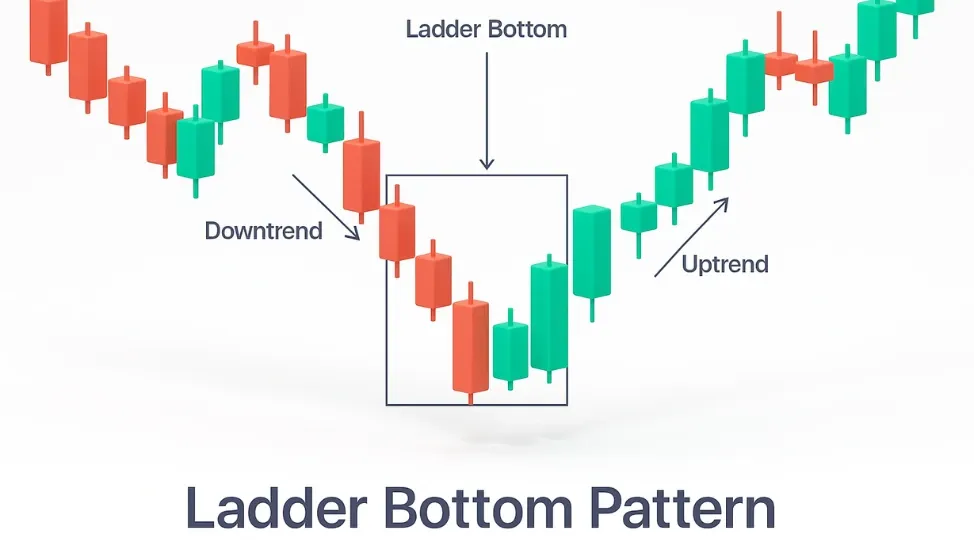
The Ladder Bottom comprises five candles:
- Three long bearish candles.
- A small candle (bearish or bullish), showing indecision.
- A long bullish candle that breaks the pattern.
What It Signifies: This signals a potential shift from a downtrend to an uptrend, indicating that selling pressure is diminishing.
Bearish Candlestick Patterns
Bearish candlestick patterns suggest a potential downward reversal and typically appear after an uptrend or a strong bullish run. Here are important bearish formations:
Bearish Engulfing Pattern:
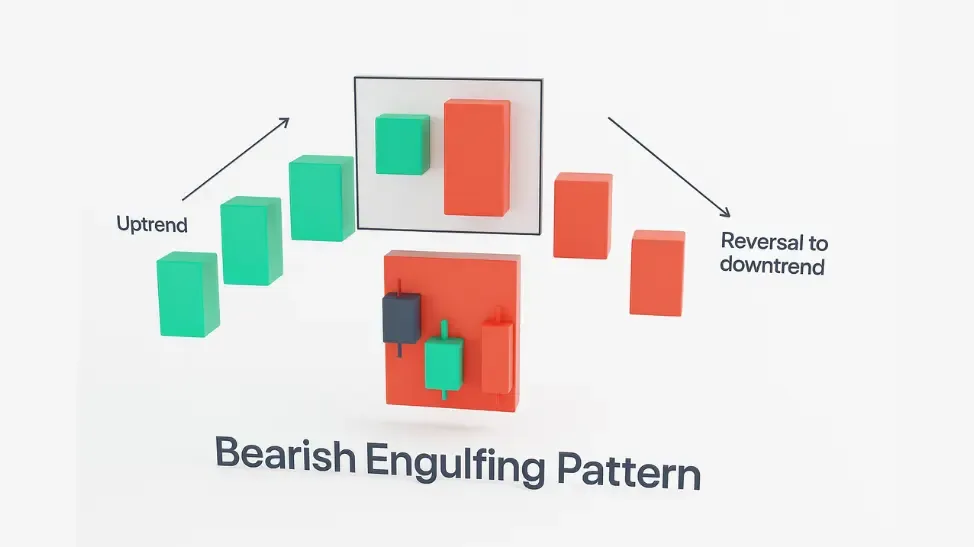
This pattern consists of two candles:
- The first is a small bullish (green) candle.
- The second candle, a substantial bearish (red) one, then fully encompasses the body of the preceding candle.
What It Suggests: This formation signals that selling pressure has overtaken buying interest, often foreshadowing further price declines as the market shifts in favour of sellers.
Three Black Crows Pattern:
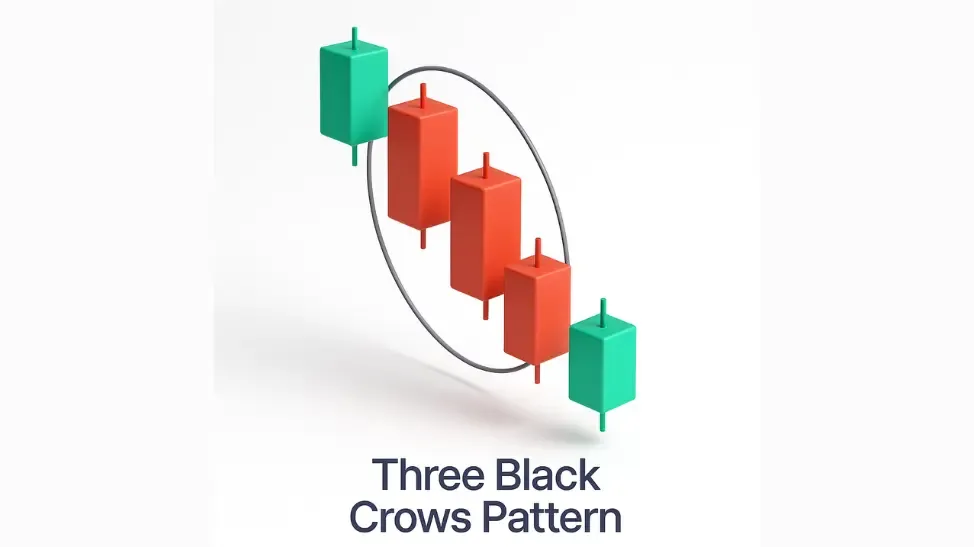
This pattern displays three consecutive substantial bearish candles. Each of these candles closes at a progressively lower price, and they all have minimal or no wicks.
What It Suggests: It represents a clear sign of persistent selling. This pattern indicates sustained selling pressure, frequently confirming that a bearish trend will continue.
Belt Hold Pattern:
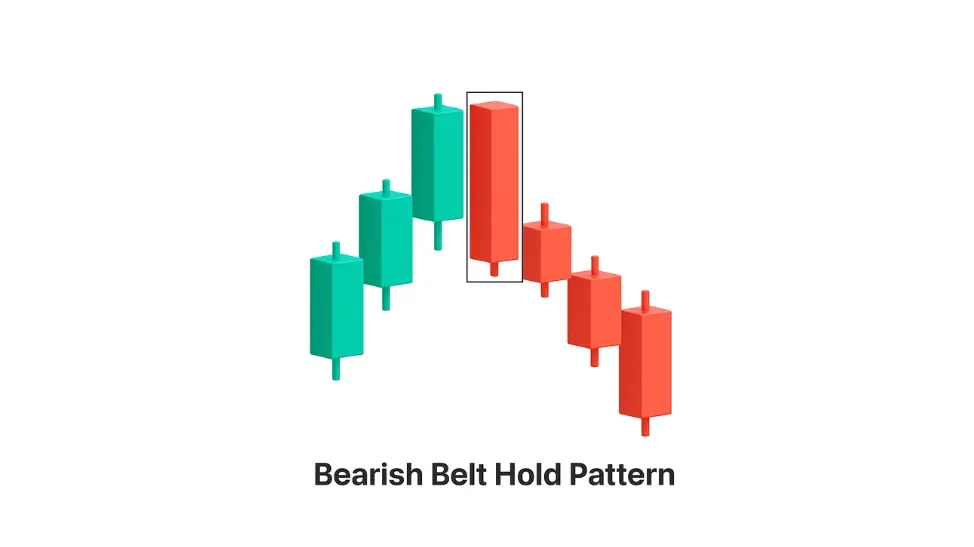
Occurs during an uptrend and features a single long red candle that:
- Opens at or near the day’s high
- Closes near the day’s low
- Has little or no upper shadow
What It Suggests: A sudden surge in selling signals a potential reversal. The significant price drop indicates that sellers are reasserting their dominance.
Bearish Hanging Man Pattern:
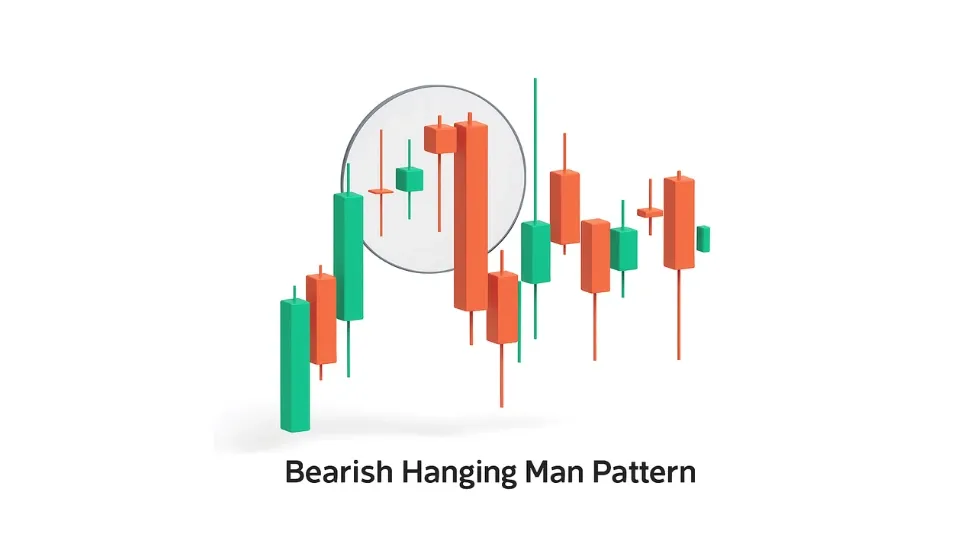
A Hanging man pattern is found at the end of an uptrend. It has:
- A compact real body positioned towards the upper end of its price range
- A long lower shadow
- Little to no upper wick
What It Suggests: This indicates that sellers began to step in during the session. Even if the close is still near the high, the selling pressure signals that the uptrend could be weakening.
Bearish Three-Line Strike Candlestick Pattern:
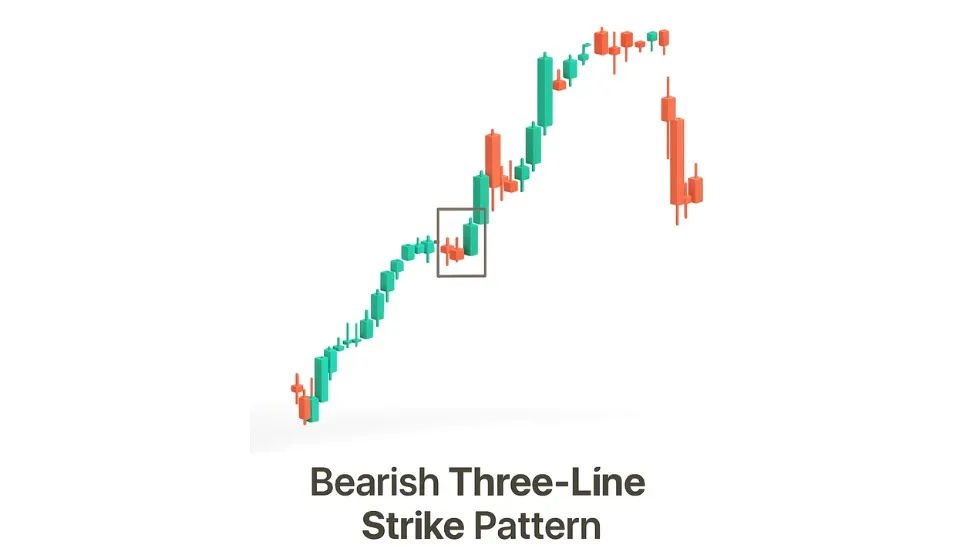
Composed of:
- Three red candles that steadily move lower
- A final, large green candle that opens below and closes above the open of the first red candle
What It Suggests: Despite the strong bullish fourth candle, the prevailing bearish momentum may continue. The short-lived upturn could merely represent a temporary halt before additional declines.
Upside Gap Two Crows Pattern:
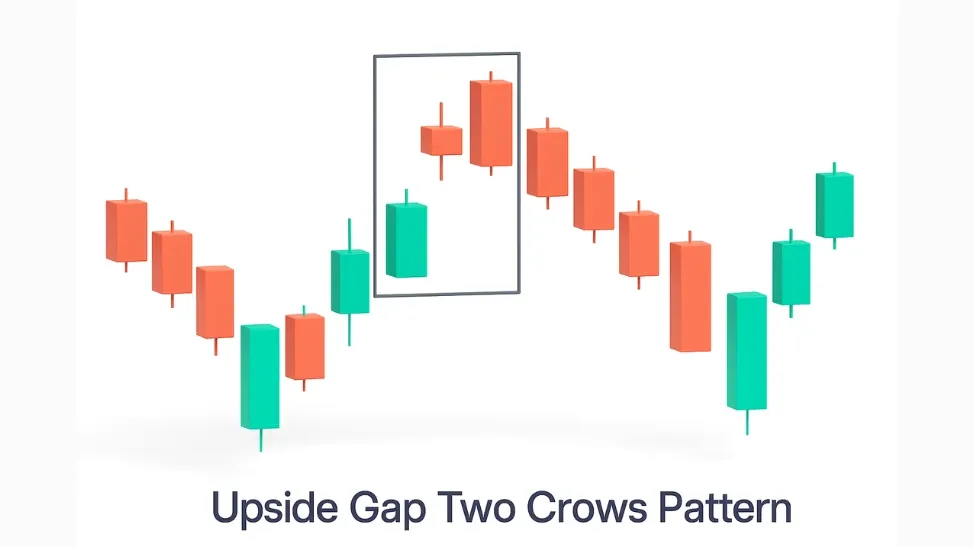
This formation consists of three candles:
- A long bullish candle
- A small bearish (red) candle that opens above the prior day's closing price.
- Another red candle that opens above the second but closes below it
What It Suggests: This configuration indicates uncertainty and potential weakness in an ongoing uptrend. It often precedes a bearish reversal or temporary consolidation.
Bearish Evening Star Pattern:
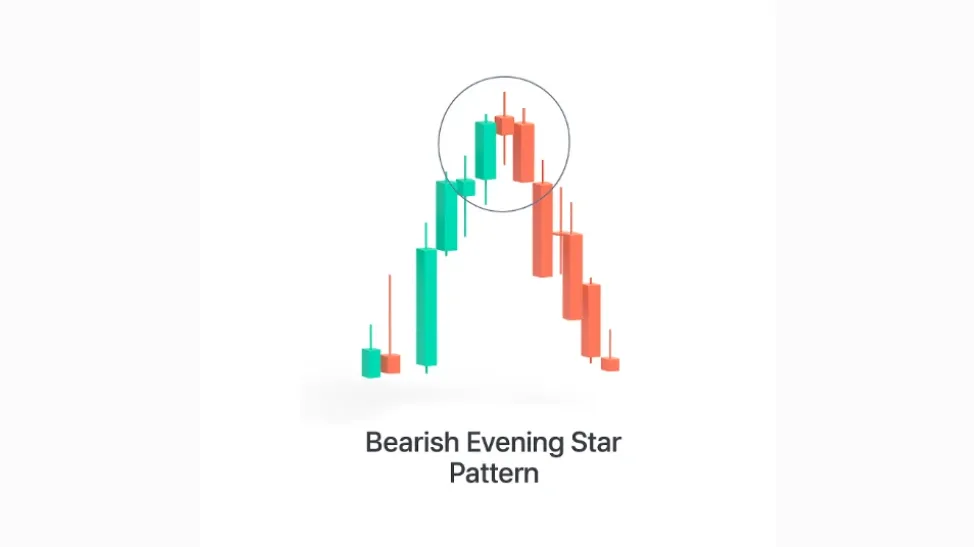
A three-candle formation made up of:
- A strong bullish candle
- A candle with a compact body (regardless of being bullish or bearish) forms after gapping upward.
- Subsequently, a considerable bearish candle forms, its closing price well within the preceding candle's range.
What It Suggests: This evening star candlestick pattern reflects a loss of upward momentum followed by a shift to bearish sentiment. This is regarded as a powerful indicator of a trend shift.
Bearish Harami Pattern:
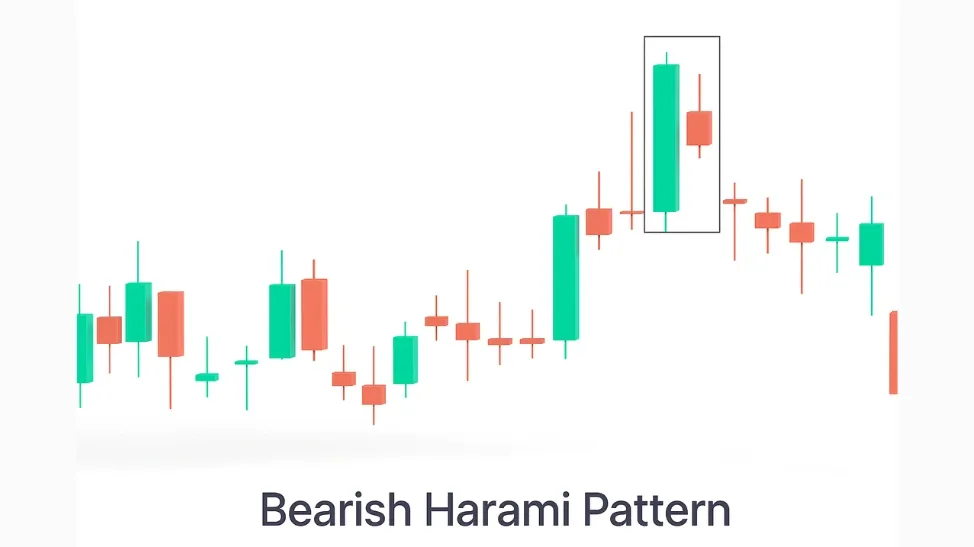
The pattern consists of two candles: first, a large bullish candle, and then a smaller bearish candle that opens and closes entirely within the first candle's real body.
What It Suggests: The pattern highlights a weakening of buying pressure. This change in momentum could result in a downward price reversal.
Shooting Star Pattern:
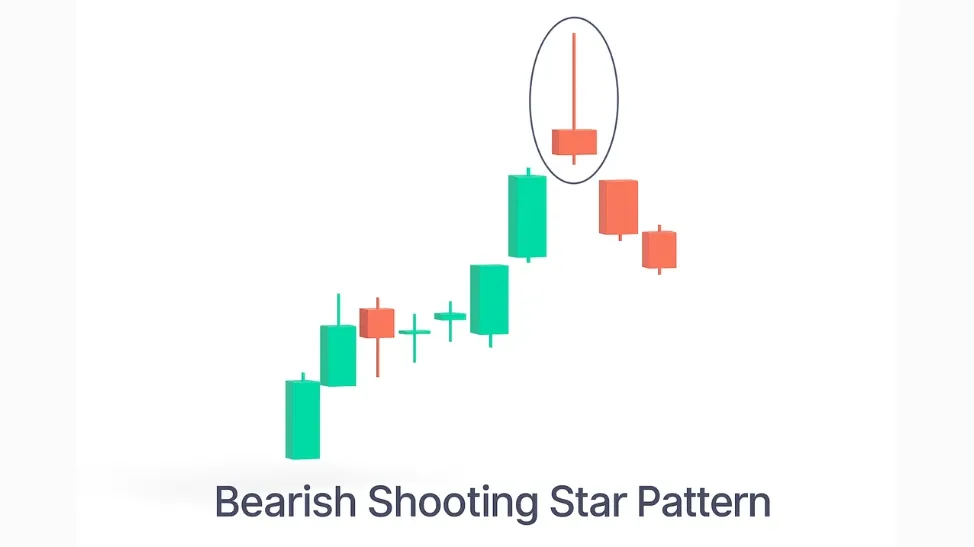
The shooting star candle pattern emerges following an upward price trend. It features:
- A small body near the day’s low
- A long upper wick
- Little to no lower shadow
What It Suggests: Buyers initially drove prices higher, but sellers quickly regained control. This sudden change in sentiment often hints at the start of a downward reversal.
Doji Star Pattern:
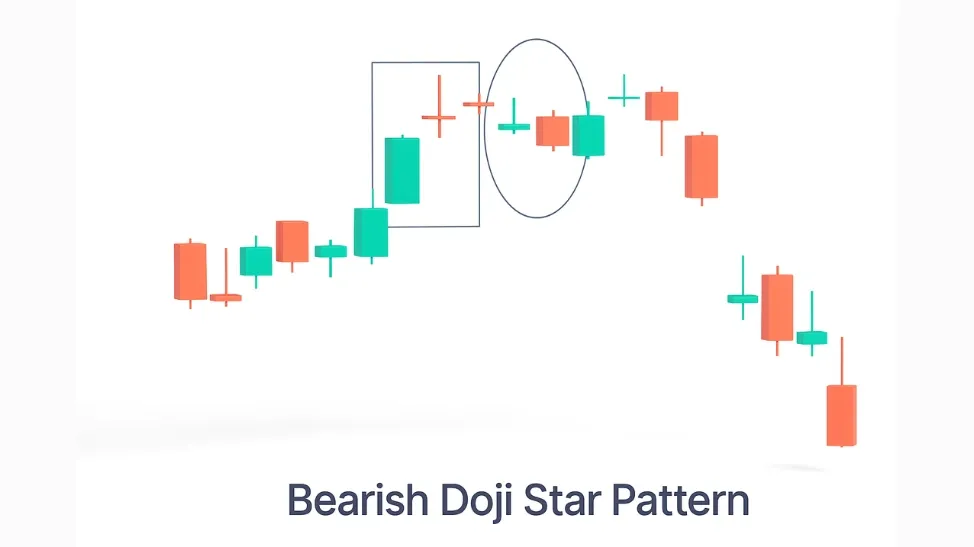
Formed by two candles:
- A strong bullish candle
- A Doji, which has a very small or absent body, forms after the price gaps upward.
What It Suggests: The Doji reflects market uncertainty. If a bearish candle follows it, it serves as confirmation of a potential trend reversal to the downside.
Tweezer Top Candlestick Pattern:
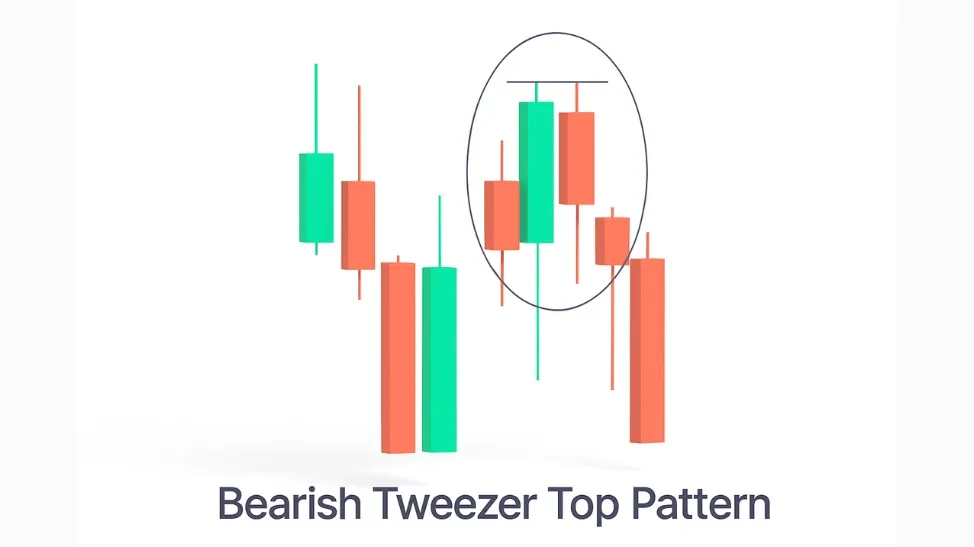
This pattern typically features two or more candles with nearly identical highs. An initial upward movement is shown by the first candle, contrasted by a subsequent downward movement in the next.
What It Suggests: Repeated rejection at the same price level suggests the uptrend is losing steam, signalling a possible upcoming decline.
Bearish Abandoned Baby Pattern:
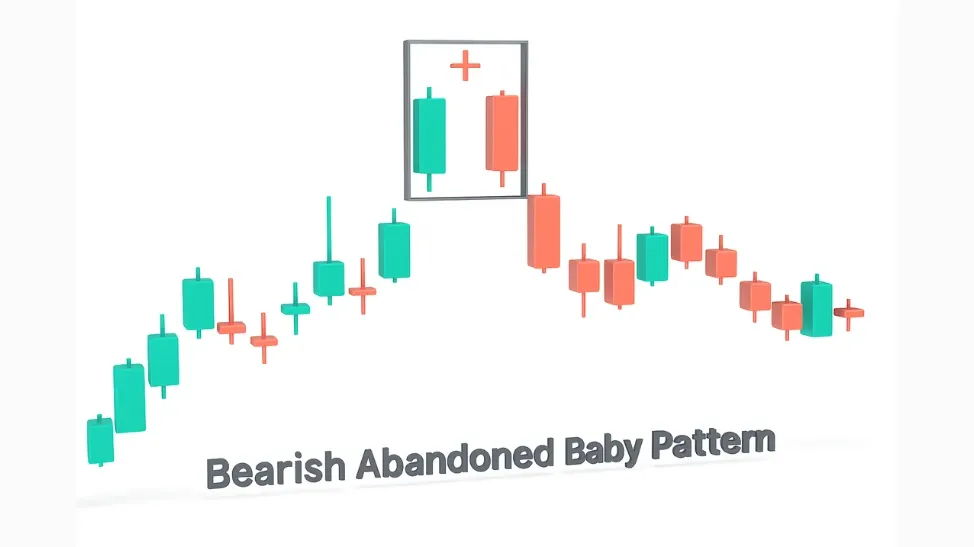
This three-candle formation begins with an extended bullish candle, then a Doji appears, gapping above the prior close. The pattern concludes with a bearish candle that both opens and closes below the Doji.
What It Suggests: This rare pattern indicates a sudden and sharp shift from bullish to bearish sentiment, often forecasting the beginning of a new downtrend.
Bearish Kicker Candlestick Pattern:
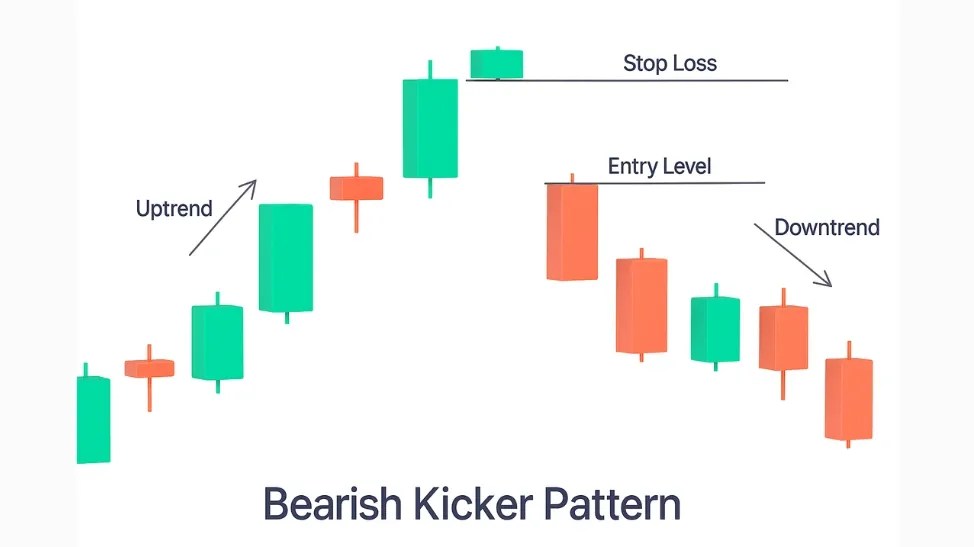
This setup includes a bullish candle followed by a strong bearish candle that opens below the previous candle’s open and closes significantly lower.
What It Suggests: It indicates a sharp turnaround in overall market sentiment. The sudden drop suggests sellers have taken full control.
Three Outside Down Candlestick Pattern:
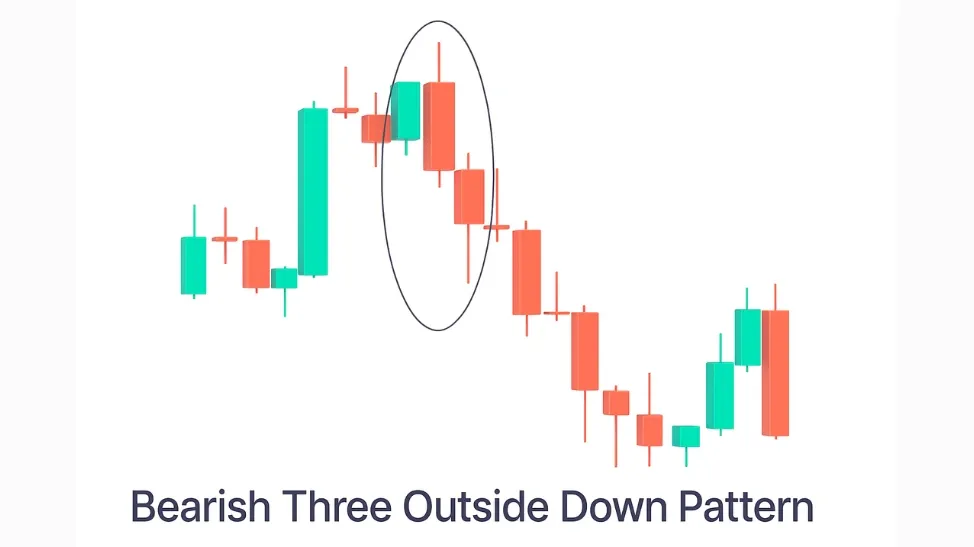
This formation includes:
- A bullish candle
- A substantial bearish candle then appears, fully encompassing the initial candle.
- Another bearish candle closing even lower
What It Suggests: Strong confirmation of a bearish reversal, showing increasing strength from sellers.
Three Inside Down Candlestick Pattern:
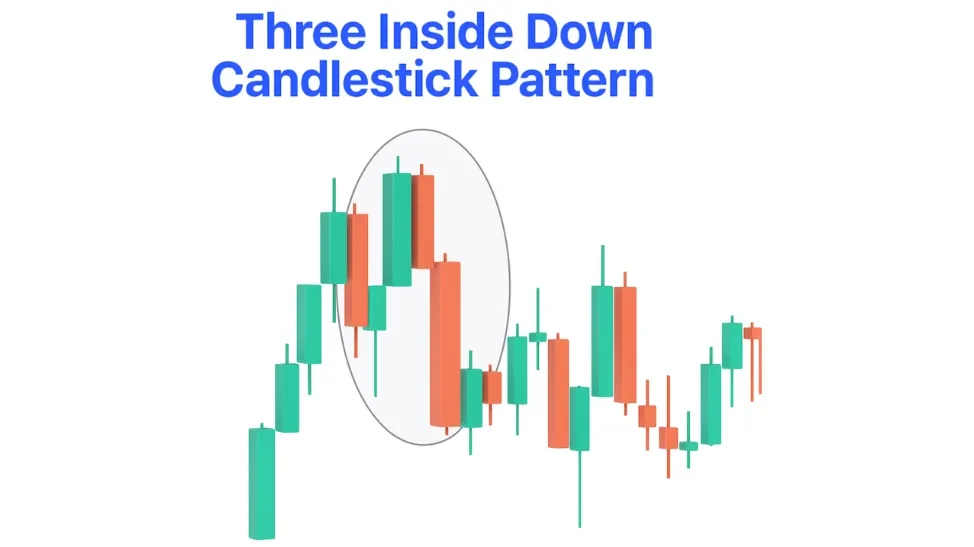
A three-candle pattern where:
- The first candle is bullish
- The second is a smaller bearish candle within the first
- Lastly, a third bearish candle forms, its closing price falling below the opening price of the initial candle.
What It Suggests: This pattern confirms that selling pressure is gaining dominance, validating a shift from an upward trend to a potential decline.
Dark Cloud Cover Pattern:
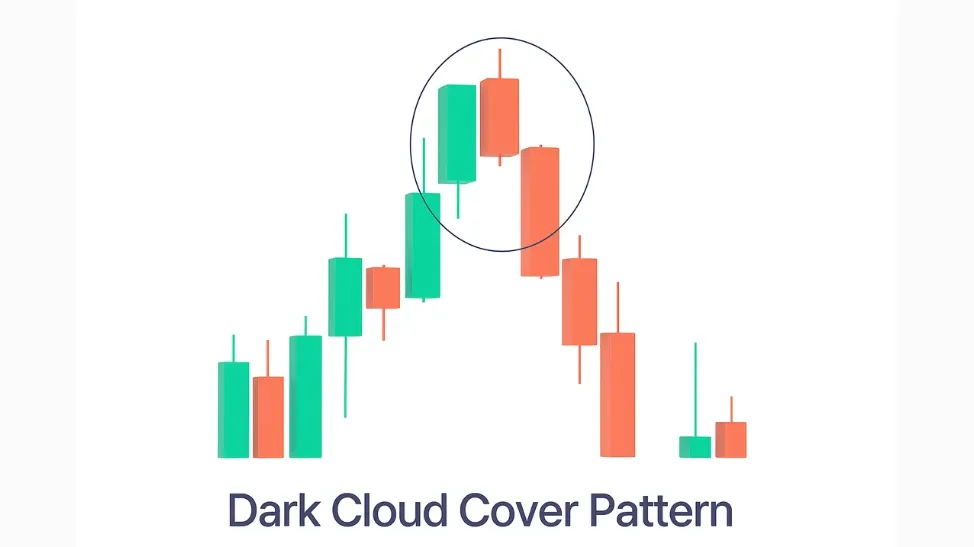
This two-candle pattern starts with a powerful bullish candle. The subsequent candle opens higher than the first's peak, yet it finishes trading below the midpoint of that initial candle's body.
What It Suggests: The dark cloud cover Candlestick pattern shows that sellers have entered with force, potentially marking the end of the uptrend and the beginning of a bearish reversal.
Mat Hold Candlestick Pattern:
This pattern consists of five candles:
- It starts with a substantial bearish candle.
- Following this, three smaller bullish candles appear, each staying within the price boundaries set by the first candle's high and low.
- The pattern finishes with an additional significant bearish candle that drops beneath the initial candle's low.
What It Suggests: This is a continuation pattern, indicating a short upward pause before the existing downtrend is likely to resume.
Pro Tip: Always consider the broader market context, trend direction, and combine with other indicators before acting on a single candlestick signal. Solely depending on Candlestick chart patterns, in the absence of additional data, may generate inaccurate signals and heighten trading risk.
Final Thoughts
Candlestick charts have earned their place as one of the most valuable tools in a trader’s arsenal. They offer a unique blend of price data and market psychology, allowing traders to interpret the balance between buying and selling pressure with clarity and speed. By understanding the types of candlesticks, these patterns provide an intuitive way to observe how the market is behaving in real time.
However, it’s essential to remember that candlestick patterns are not standalone predictors. Their strength lies in being part of a broader technical analysis strategy- one that incorporates volume, indicators, support/resistance levels, and most importantly, sound risk management.
Related Blog
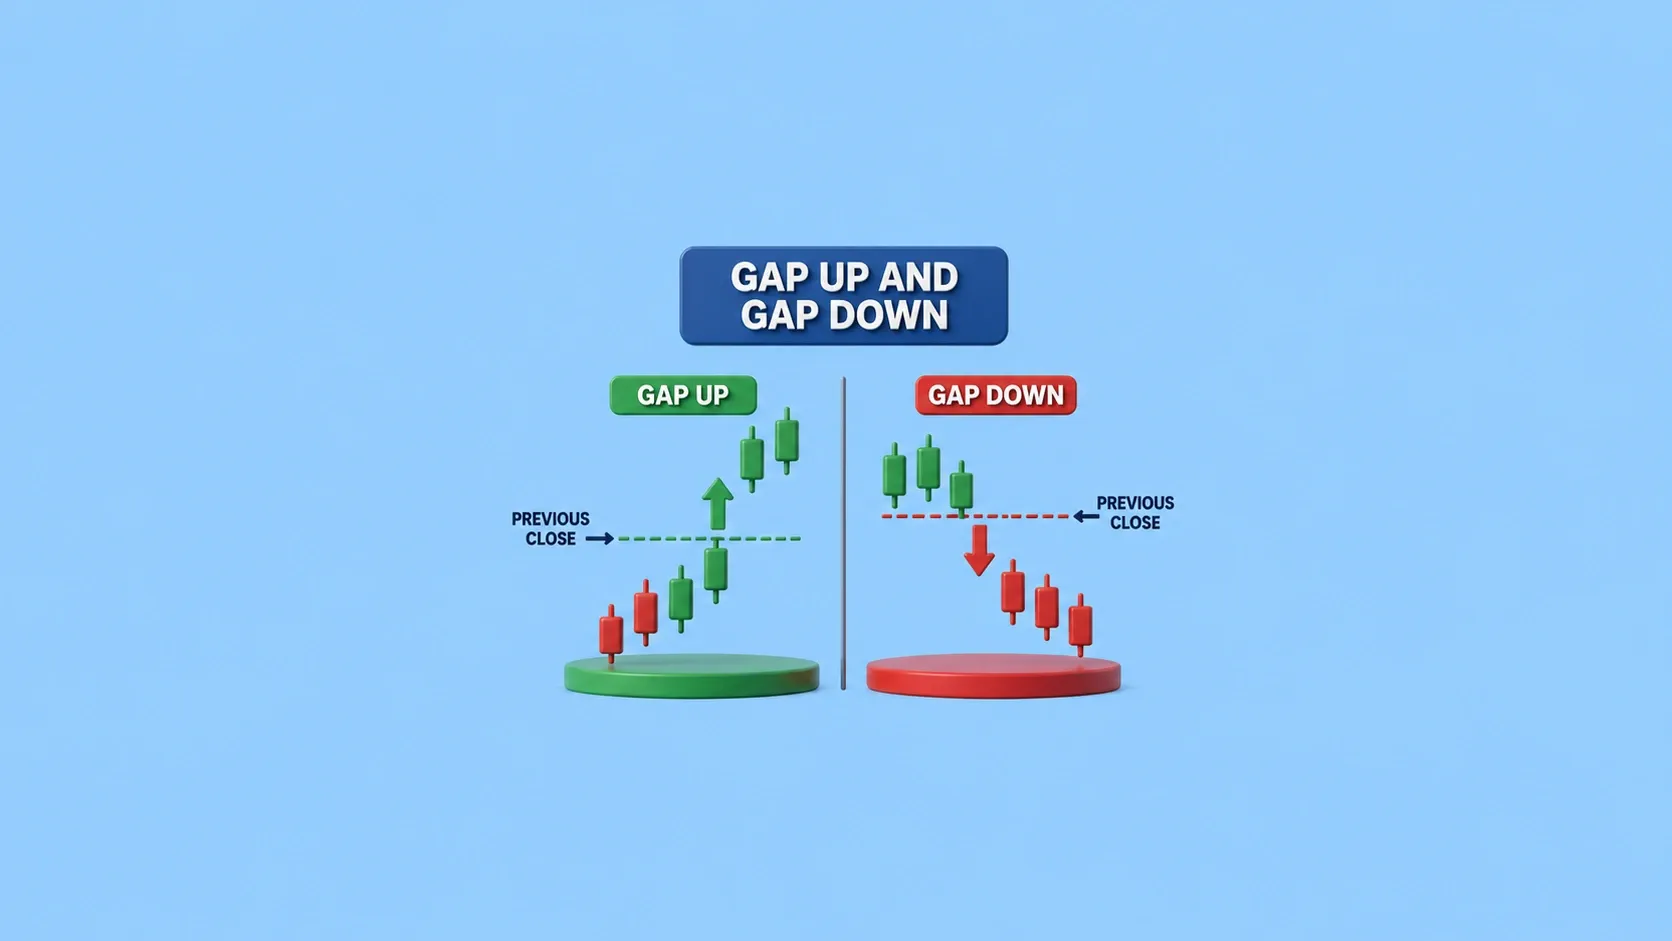
Have you ever opened your trading app and noticed that a stock or the Nifty 50 opened significantly higher or lower than its previous day's closing price? This price difference is known as a gap up and a gap down, and it often reflects a sudden change in market sentiment caused by overnight events. Whether you're an intraday trader or a beginner, understanding what gap up and gap down are can help you make better trading decisions. These price gaps are often triggered by overnight events such a
29 July 2026
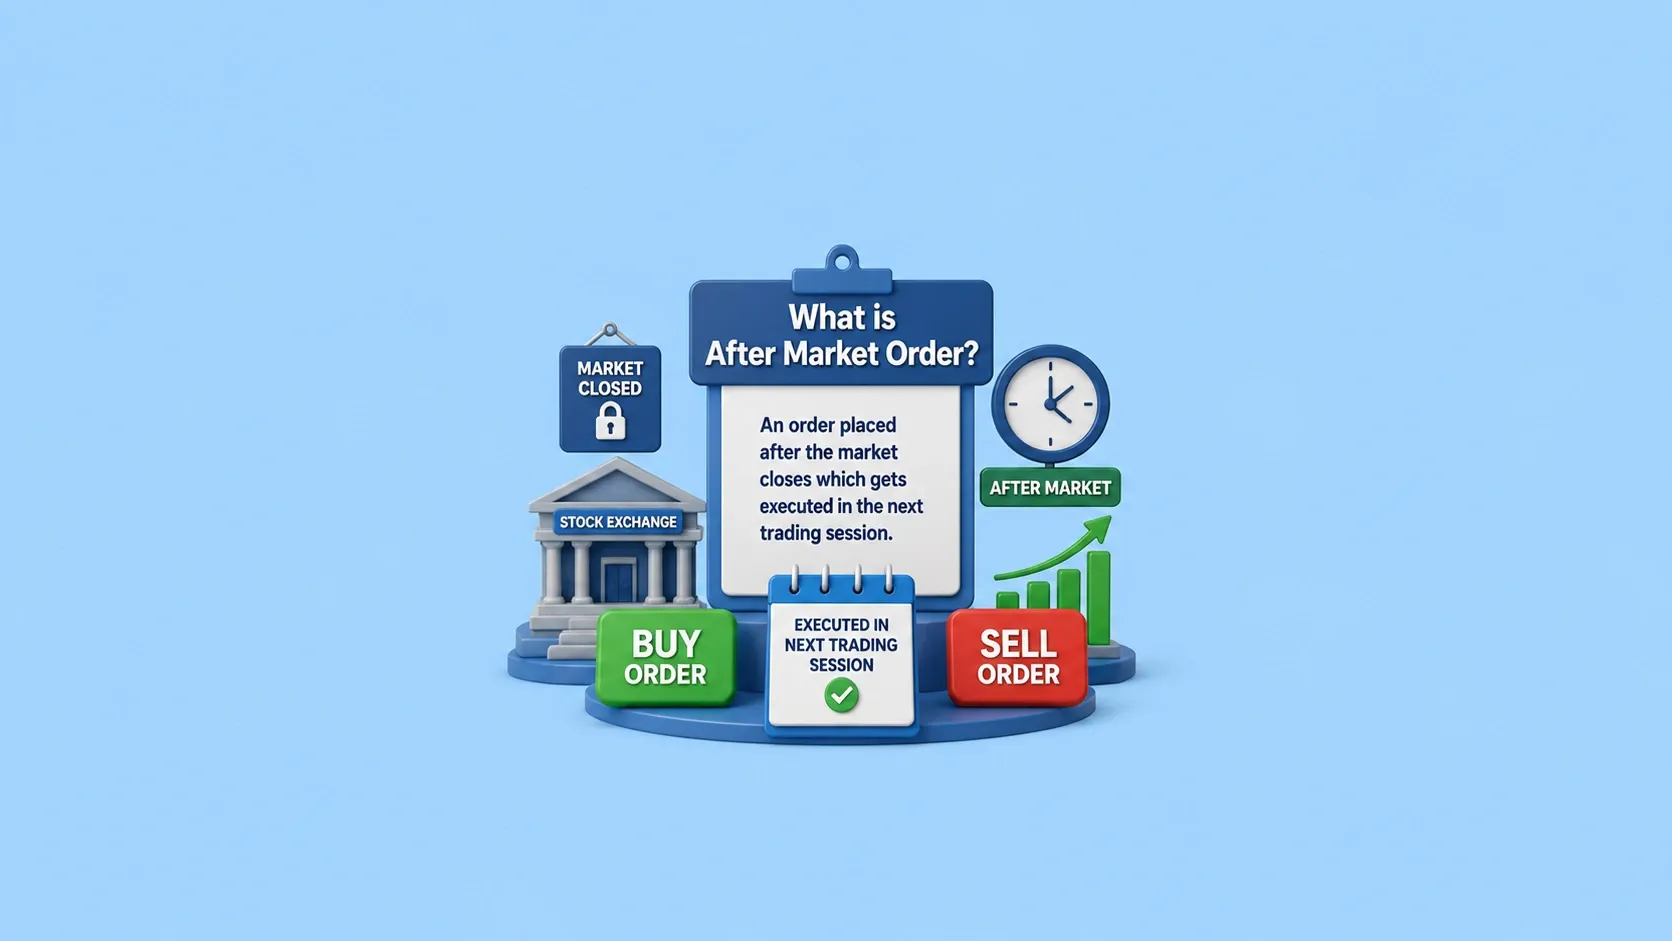
Keeping an eye on the stock market throughout trading hours isn't always possible. But that doesn't mean you have to sit out until the next trading day to act on your investment decisions. This is where the After- Market Order (AMO) comes in, allowing you to place your trades even when the market is closed. In this blog, we'll break down what after-market orders are, how they work, their key characteristics, benefits and limitations, and the different types available to investors. What is An
29 July 2026

FII DII Data Today 29th July 2026 CATEGORY DATE BUY VALUE (₹ Crores) SELL VALUE (₹ Crores) NET VALUE (₹ Crores) DII 29-July-2026 16,187.74 15,136.81 1,050.93 FII 29-July-2026 16,352.31 13,472.38 2,879.93 What are FII and DII in the Stock Market Foreign Institutional Investors (FIIs) invest in the Indian stock market from international markets, while Domestic Institutional Investors (DIIs) include mutual funds and institutional bodies operating from India. fii dii data helps trac
28 July 2026
Made for Traders.
Trusted by Investors.
Download FinX — trade confidently, invest
smarter, track everything.
