
The overall month has been quite unpredictable. While many on the chart stood strong, most of them have slipped. Bank Nifty on the other hand maintained its grip for a long time but now appears slightly bearish. Let’s see what the coming month holds for the investors as Mr. Sumeet Bagadia, Executive Director of Choice takes us through the weekly predictions of the market.
Nifty Prediction For Next Week (13th July - 17th July 2026)
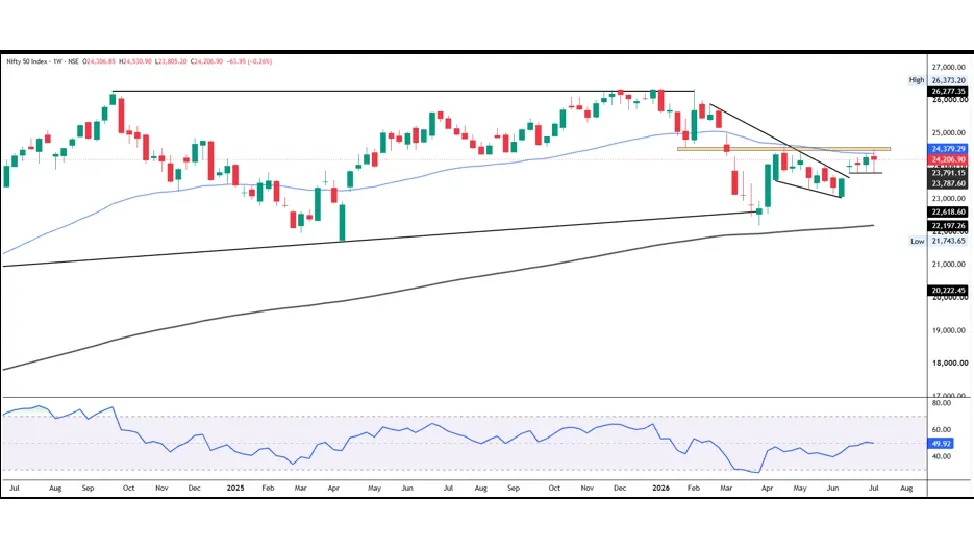
The Nifty index started the week on a positive note, opening at 24,306.85 and extended its gains in the initial sessions to register the week's high of 24,530.90. However, the index witnessed strong rejection from higher levels, coinciding with the 200-Day EMA resistance zone on the daily chart, which triggered broad-based profit booking. The selling pressure intensified during the mid-week sessions, erasing the early gains and dragging the index to the week's low of 23,805.20. Buying interest emerged around this crucial support zone, helping the index recover a major part of the decline. Nifty eventually settled at 24,206.90, down 63.95 points (-0.26%) for the week, reflecting continued consolidation after the recent recovery.
The weekly price action indicates a volatile but range-bound market, with buyers consistently defending the 23,800 support zone while sellers remain active near the 24,500 resistance area. This suggests that the index is consolidating within a broader trading range, awaiting a decisive breakout for the next directional move.
From a technical perspective, Nifty has formed a Doji-like candlestick pattern on the weekly chart, indicating indecision as the index continues to trade within a well-defined sideways range. The weekly RSI is placed near 55.80, reflecting positive momentum while remaining comfortably above the neutral 50 mark, suggesting that the broader undertone continues to favor buyers. Meanwhile, the MACD remains in positive territory with the MACD line trading above the signal line, although the narrowing histogram indicates that bullish momentum has moderated and a fresh trigger will be required for the next up move.
On the derivatives front, the highest Open Interest (OI) on the Call side is concentrated at 24,500 CE, followed by 24,300 CE, indicating a strong resistance zone. On the Put side, the highest OI concentration is seen at 24,200 PE, followed by 24,000 PE, highlighting a firm support base and suggesting that market participants continue to adopt a buy-on-dips approach within the prevailing range.
On the upside, immediate resistance levels are placed at 24,500 and 24,600. A sustained move above this zone could trigger fresh buying momentum and pave the way for further upside. On the downside, support is placed at 23,800 and 23,700. A decisive breakdown below these levels may weaken the near-term structure and invite renewed selling pressure. Considering the current technical setup, traders are advised to maintain a stock-specific approach while following strict risk management until a decisive breakout from the ongoing consolidation range emerges.
| Nifty 50 View | Levels |
|---|---|
| Support | 23,800 - 23,700 |
| Resistance | 24,500 - 24,600 |
| Bias | Sideways to Bullish |
Also know: Tomorrow market prediction
Bank Nifty Prediction For Next Week (13th July - 17th July 2026)
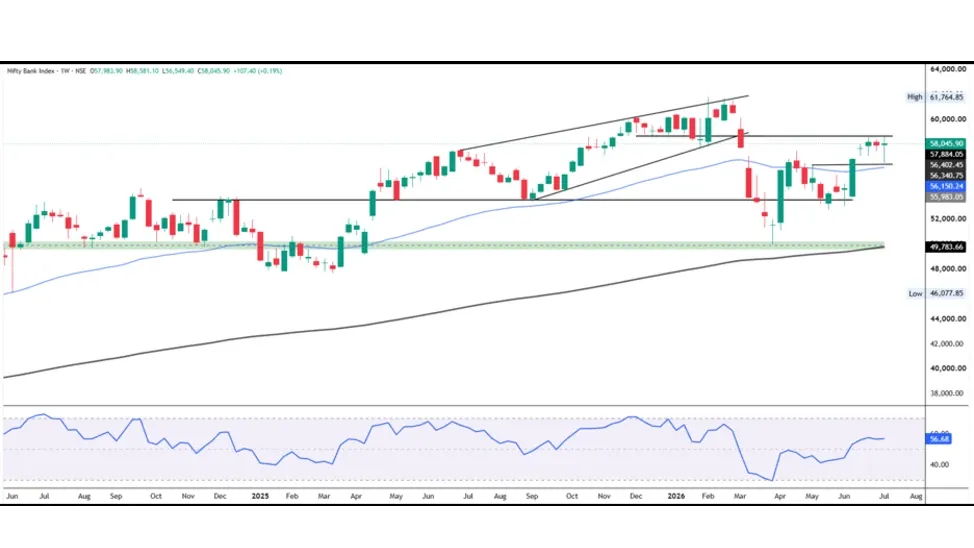
The Bank Nifty index started the week on a flat note, opening at 57,983.90 and witnessed steady buying interest during the initial sessions. The positive momentum helped the index climb to a weekly high of 58,581.10 on Tuesday. However, the rally failed to sustain at higher levels as profit booking emerged, dragging the index lower during the mid-week sessions. The decline extended towards the weekly low of 56,549.40 before fresh buying interest resurfaced from lower levels.
In the latter half of the week, Bank Nifty staged a strong rebound after taking support near the previous swing-high breakout zone, which also coincided with the 20-week and 50-week EMA support area. The recovery was primarily led by strength in PSU banking stocks, while heavyweight HDFC Bank, which gained around 3% during the week, provided significant support to the index. Bank Nifty eventually settled at 58,045.90, registering a marginal weekly gain of 107.40 points (+0.19%).
Technically, Bank Nifty formed a Doji-like candlestick on the weekly chart, reflecting indecision after the recent upmove. The index continued to trade within the last 3–4 weeks' consolidation range, but the successful rebound from the 20-week and 50-week EMA support zone, aligned with the previous swing-high breakout level, suggests that buyers remain active on declines and the broader bullish structure remains intact. Price action indicates demand emerging at lower levels, while higher levels continue to witness profit booking, resulting in a healthy consolidation within the prevailing uptrend. As long as the index sustains above the breakout support zone, the medium-term trend is likely to remain positive. The Weekly RSI stands at 56.88, remaining comfortably above the neutral 50 mark, indicating sustained positive momentum despite the ongoing consolidation
| Nifty Bank View | Levels |
|---|---|
| Support | 57,400–57,000 |
| Resistance | 58,700–59,000 |
| Bias | Sideways to Bullish |
Technical Research - Team Choice gives the prediction.
Keep watching this space as we bring you expert analysis and recommendations. Also, follow our research section where we give you expert research on fundamental and technical stocks. All this is available on our Choice FinX trading app.
Disclaimer: Investments in the securities market are subject to market risks, read all the related documents carefully before investing.
Related Blog
Market ups and downs often cause investors to sell stocks due to fear, even when the companies have strong long-term potential. A contra mutual fund takes the opposite approach by investing in such undervalued or overlooked companies with the expectation that they may recover over time. Understanding what a contra fund is can help you determine whether this investment strategy aligns with your financial goals and risk appetite. Like other Mutual funds, contra funds are regulated by SEBI and man
13 July 2026

FII DII Data Today 13th July 2026 CATEGORY DATE BUY VALUE (₹ Crores) SELL VALUE (₹ Crores) NET VALUE (₹ Crores) DII 13-July-2026 15,843.01 13,488.43 2,354.58 FII 13-July-2026 9,613.38 13,009.18 -3,395.80 What are FII and DII in the Stock Market Foreign Institutional Investors (FIIs) invest in the Indian stock market from international markets, while Domestic Institutional Investors (DIIs) include mutual funds and institutional bodies operating from India. fii dii data helps trac
12 July 2026

Nifty Prediction For Tomorrow By An Expert Nifty 50 ended the session almost unchanged at 24,211.00, up 4.10 points (+0.02%), after witnessing a volatile trading session. The index opened with a gap-down of around 167 points and slipped to an intraday low of 24,000.20 during the opening minutes. However, strong buying interest emerged near the psychological 24,000 mark, helping the index recover steadily throughout the day. Nifty later touched an intraday high of 24,259.80 before witnessing min
12 July 2026
Made for Traders.
Trusted by Investors.
Download FinX — trade confidently, invest
smarter, track everything.
