


Triveni Power Transmission Share Price Chart
Triveni Power Transmission FAQs
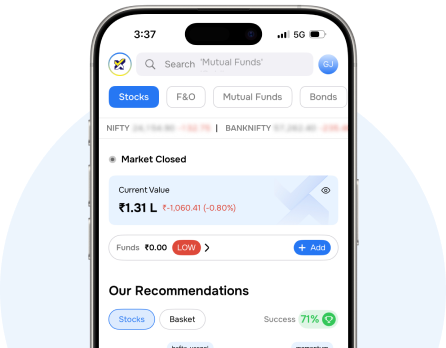
To read Triveni Power Transmission’s price chart on the Choice FinX platform log in to your Choice trading account, or open a Free Demat account . Here you can customise your view using various tools for detailed analysis.
Key chart patterns for analysing Triveni Power Transmission’s include trend lines, support/resistance zones, volume patterns, and price formations specific to Triveni Power Transmission's trading behavior.
To identify the key price levels of Triveni Power Transmission, track the company's historical prices, moving averages, volume patterns, and previous highs/lows to spot important trading levels.
Monitor trading volumes alongside price movements of Triveni Power Transmission to confirm trends and to spot institutional activity.
Open Your Free
Demat Account Now!
 AMC for First Year
- Auto Square Off Charges
 13 Lakh+ Clients
 Expert-Backed
 Premium Tools
Open Your Free
Demat Account Now!
- AMC For First Year
- Account Opening Fee
- 13 Lakh+ Clients
- Expert-Backed
- Premium Tools
Invest in TRIVENIPT


