


SBI Nifty 1D Rate Liquid ETF - IDCW Share Price Chart
SBI Nifty 1D Rate Liquid ETF - IDCW FAQs
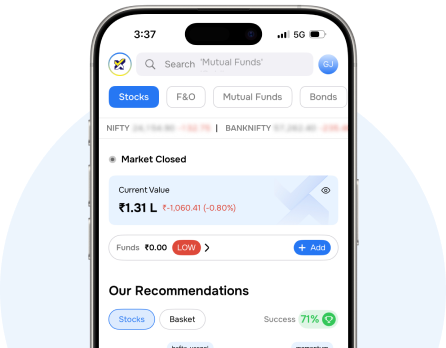
To read SBI Nifty 1D Rate Liquid ETF - IDCW’s price chart on the Choice FinX platform log in to your Choice trading account, or open a Free Demat account . Here you can customise your view using various tools for detailed analysis.
Key chart patterns for analysing SBI Nifty 1D Rate Liquid ETF - IDCW’s include trend lines, support/resistance zones, volume patterns, and price formations specific to SBI Nifty 1D Rate Liquid ETF - IDCW's trading behavior.
To identify the key price levels of SBI Nifty 1D Rate Liquid ETF - IDCW, track the company's historical prices, moving averages, volume patterns, and previous highs/lows to spot important trading levels.
Monitor trading volumes alongside price movements of SBI Nifty 1D Rate Liquid ETF - IDCW to confirm trends and to spot institutional activity.
Open Your Free
Demat Account Now!
 AMC for First Year
- Auto Square Off Charges
 13 Lakh+ Clients
 Expert-Backed
 Premium Tools
Open Your Free
Demat Account Now!
- AMC For First Year
- Account Opening Fee
- 13 Lakh+ Clients
- Expert-Backed
- Premium Tools
Invest in LIQUIDSBI


