

The central pivot range (CPR) is a technical analysis tool that helps traders identify potential support, resistance, and trend direction before the market opens. It consists of three levels: the Pivot Point (PP), Bottom Central (BC), and Top Central (TC).
Think of CPR as a roadmap for the trading day. If prices stay above the CPR, the market is generally considered bullish. If prices remain below the CPR, the sentiment may be bearish. When prices move within the CPR, the market may be in a consolidation phase.
One of the reasons CPR is widely used is its simple calculation method and easy-to-understand price levels, making it accessible for both new and experienced traders.
Central Pivot Range Formula
Understanding the central pivot range formula is important because all CPR levels are calculated from the previous day’s price data.
Formulas are:
- Pivot Point (PP) = (High + Low + Close) ÷ 3
- Bottom Central (BC) = (High + Low) ÷ 2
- Top Central (TC) = (Pivot Point × 2) − Bottom Central
For example, if yesterday’s High was ₹520, the Low at ₹500, and Close being ₹510:
- PP = (520 + 500 + 510) ÷ 3 = ₹510
- BC = (520 + 500) ÷ 2 = ₹510
- TC = (510 × 2) − 510 = ₹510
In actual market conditions, the values are usually different, creating a visible range on the chart.
How to Calculate Central Pivot Range
Learning how to calculate the central pivot range is straightforward. You only need the previous day’s High, Low, and Close.
Steps:
- Note the previous day’s High, Low, and Close.
- Calculate the Pivot Point.
- Calculate the Bottom Central.
- Calculate the Top Central.
- Plot these levels on the chart before the market opens.
Example:
- High = ₹1,050
- Low = ₹1,000
- Close = ₹1,020
PP = ₹1,023.33
BC = ₹1,025
TC = ₹1,021.66
These three levels form the CPR for the next trading session.
Central Pivot Range Indicator
The central pivot range indicator automatically plots the Pivot Point, Top Central, and Bottom Central on the chart.
One of the biggest advantages of the CPR indicator is that traders can prepare their trading plan before the market opens. If the price opens above the Top Central level and sustains there, it may indicate bullish strength. If it opens below the Bottom Central level, it may signal bearish sentiment.
Many traders combine the central pivot range indicator with RSI, moving averages, or volume analysis to improve trade confirmation.
How to Use CPR
Using CPR effectively requires observing how prices behave around the CPR levels.
Common approach:
- Price above CPR: Look for buying opportunities.
- Price below CPR: Look for selling opportunities.
- Price inside CPR: Wait for a breakout confirmation.
For example, if a stock opens at ₹780 while the Top Central level is ₹775 and continues trading above ₹775 with strong volume, traders may consider it a bullish signal.
Types of CPR
1. Narrow CPR

A narrow CPR indicates low volatility in the previous session. Traders often expect a strong breakout in the next session.
2. Wide CPR
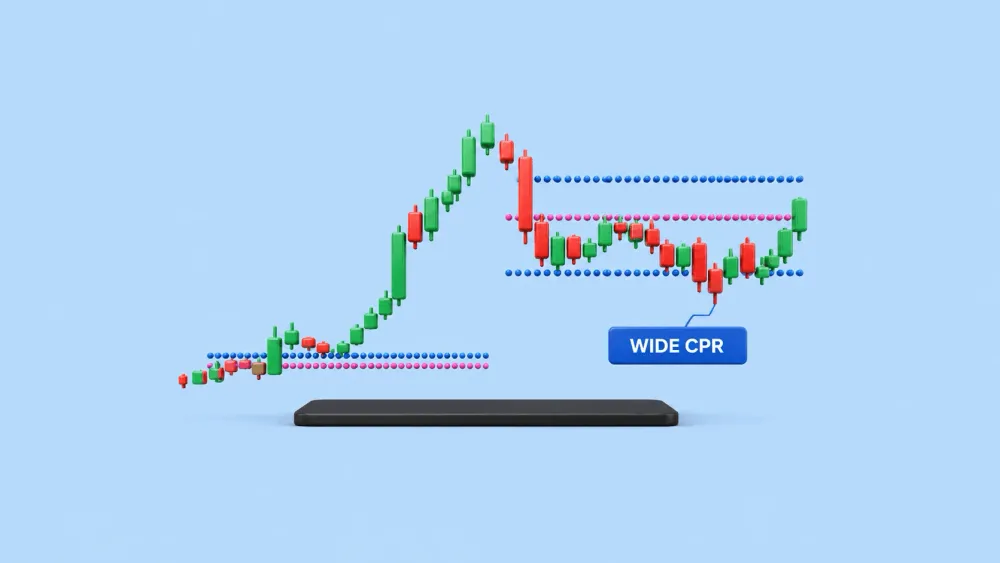
A wide CPR reflects high volatility in the previous session. Prices may remain within a broader range before making a decisive move.
3. Higher Value CPR
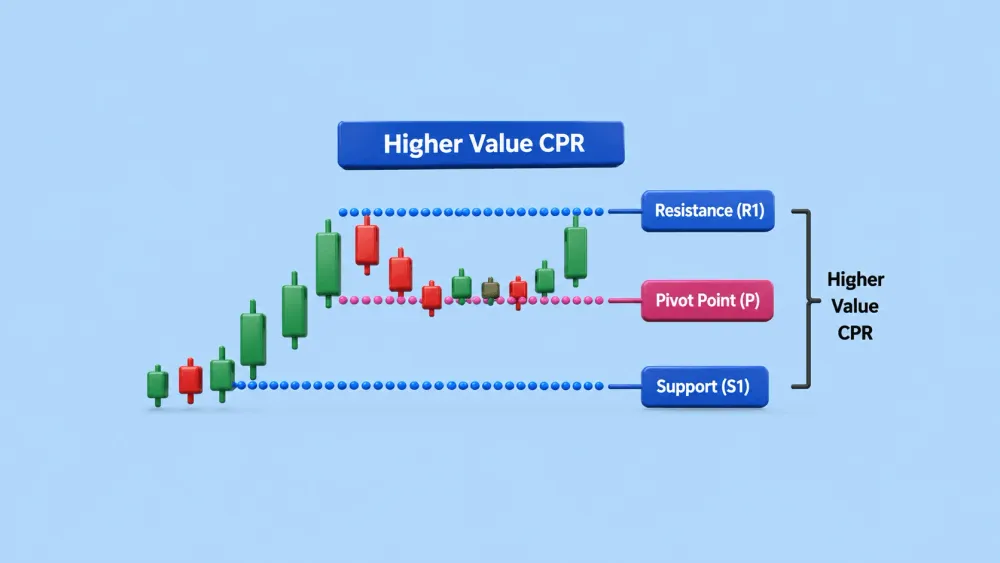
When today’s CPR is higher than the previous day’s CPR, it may indicate improving bullish sentiment.
4. Lower Value CPR
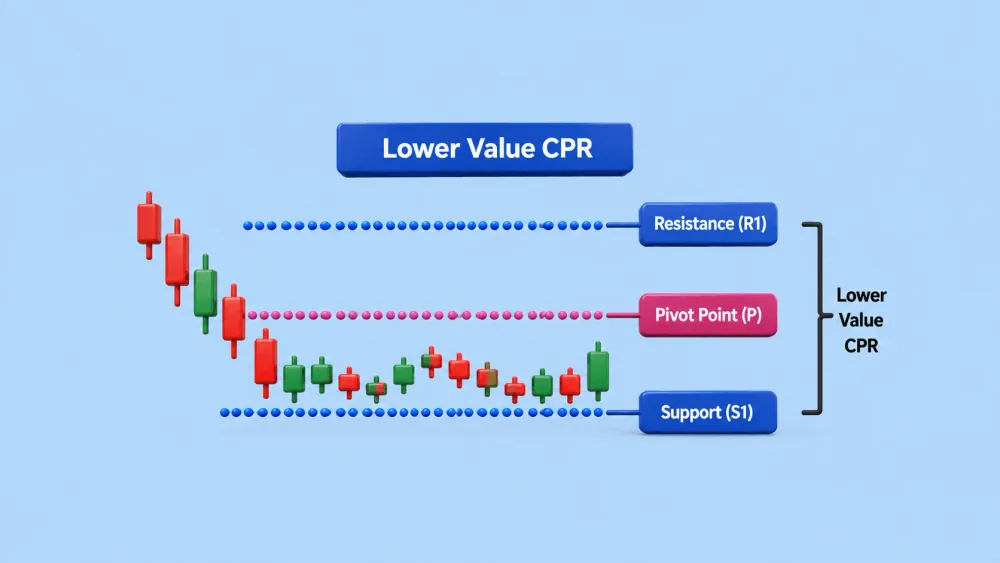
When today’s CPR is lower than the previous day’s CPR, it may indicate increasing bearish pressure.
Central Pivot Range Strategy
A practical central pivot range strategy should include entry rules, confirmation signals, and risk management.
Breakout Strategy
- Buy when the price breaks above the Top Central level with strong volume.
- Place a stop-loss below the breakout level.
- Sell when the price breaks below the Bottom Central level with confirmation.
Reversal Strategy
If the price approaches the CPR after a strong move and forms reversal candlestick patterns, traders may look for a change in direction.
Many experienced traders combine this central pivot range strategy with moving averages and volume analysis to reduce false signals.
Advantages of Using CPR Indicator
- Identifies support and resistance levels before the market opens.
- Helps create a structured trading plan.
- Useful for intraday trading in stocks, futures, and options.
- Easy to understand for beginners.
- Works well with other technical indicators.
- Helps assess overall market sentiment.
Common Tricks of Using CPR Indicator
- Wait for price confirmation before entering a trade.
- Monitor trading volume during breakouts.
- Avoid relying solely on CPR during major RBI policy announcements, Union Budget events, or important corporate earnings.
- Compare today’s CPR with previous sessions to identify trend strength.
- Always use a stop-loss order.
Conclusion
The central pivot range is one of the most practical technical analysis tools for traders who want to identify important price levels before the market opens. By understanding the central pivot range formula, learning how to calculate central pivot range, and applying the central pivot range indicator correctly, traders can make more informed decisions instead of reacting emotionally to market movements.
Like every technical indicator, CPR is not a guarantee of profits. It works best when combined with price action, volume analysis, proper risk management, and a disciplined central pivot range strategy. For both beginners and experienced traders, CPR can be a valuable addition to a well-planned trading approach.
FAQs
Is CPR a good indicator?
Yes, CPR is considered a useful indicator because it helps identify potential support, resistance, and trend direction before the trading session begins.
Is CPR useful for beginners?
Yes, as the calculations are simple and most trading platforms provide the indicator automatically, beginners can use CPR to understand price behaviour more effectively.
Does CPR work in all market conditions?
Not every. CPR can be useful in both trending and range-bound markets, but major news events and sudden volatility can reduce its reliability.
How is CPR different from regular pivot points?
Regular pivot points focus mainly on a single pivot level with support and resistance levels, while CPR uses three central levels-TC, PP, and BC, to create a range that provides additional insights into market sentiment.
What is the difference between Narrow CPR and Wide CPR?
A Narrow CPR generally indicates lower previous-day volatility and may lead to a strong breakout. A Wide CPR reflects higher volatility and often suggests a broader trading range before a decisive move occurs.
Disclaimer: This article is for educational purposes only and should not be considered investment or trading advice. Please conduct your own research or consult a financial advisor before making any investment decisions.
Made for Traders.
Trusted by Investors.
Download FinX — trade confidently, invest
smarter, track everything.

