
A false breakout is one of the most common challenges traders face in the stock market. It occurs when the price of a stock, index, or other asset moves beyond an important support or resistance level but fails to sustain the move and quickly reverses direction. Many traders mistake these temporary price movements for the beginning of a new trend, only to find themselves trapped in losing positions.
Understanding the false breakout meaning is important for anyone involved in trading because false signals can lead to poor entry points and unnecessary losses. Knowing what a false breakout is in trading, why it occurs, and how to identify false breakout situations can help traders make better-informed decisions and improve risk management. In this article, we will explore the causes, types, identification techniques, and practical ways to avoid false breakouts in trading.
What Is a False Breakout in Trading?
A false breakout occurs when the price of a stock or any financial asset temporarily moves beyond a significant support, resistance, trendline, or chart pattern but fails to sustain the move and quickly reverses back into its previous range.
In other words, the market gives the impression that a new trend has started, but the breakout lacks sufficient strength and eventually fails.
To understand what a false breakout is in trading, let’s consider this example: A stock that has been trading between ₹450 and ₹500 for several weeks. Many traders view ₹500 as a key resistance level. If the stock suddenly moves to ₹510, traders may interpret it as a bullish breakout and enter buying positions. However, if the stock falls back below ₹500 within a short period, the breakout is considered false.
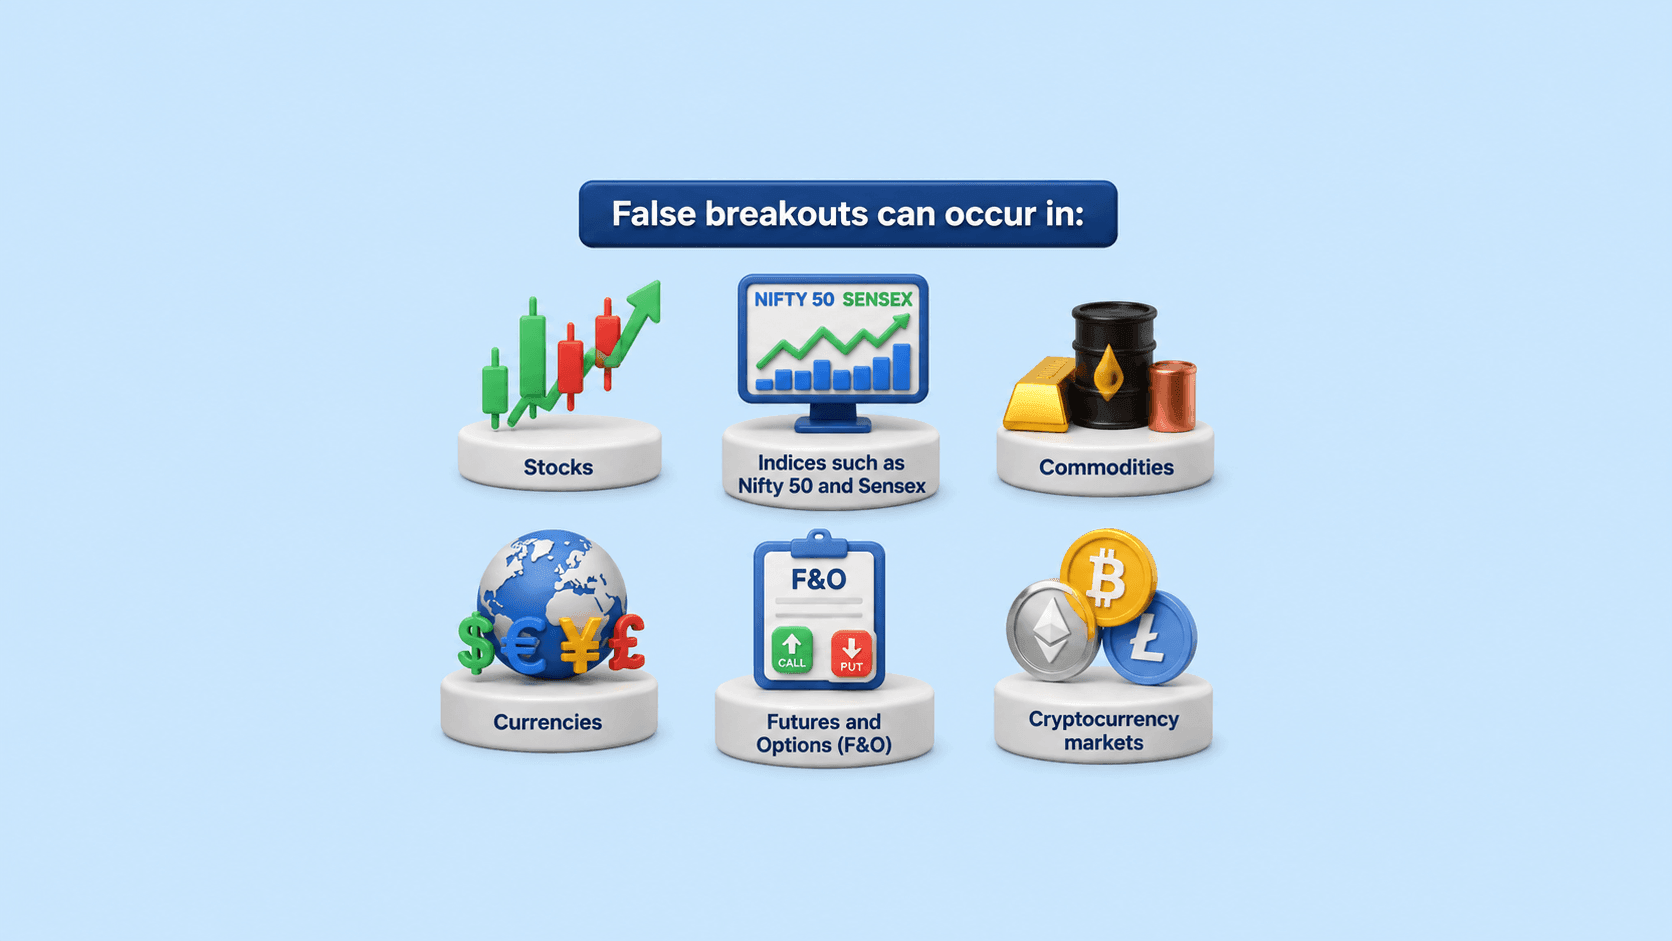
False breakouts can occur in:
- Stocks
- Indices such as Nifty 50 and Sensex
- Commodities
- Currencies
- Futures and Options (F&O)
- Cryptocurrency markets
These situations are closely linked to market psychology. Traders often rush to participate in a breakout because they fear missing a potential opportunity. When enough participants enter trades based on the breakout, but the underlying demand or supply is insufficient, the market reverses and traps those traders.
Understanding false breakout trading is important because it teaches traders to focus on confirmation rather than reacting immediately to every price movement.
Why Do False Breakouts Happen?
False breakouts occur due to a combination of market psychology, liquidity, institutional activity, and trading behaviour. Understanding the reasons behind them can help traders become more patient and disciplined.
Lack of Strong Market Participation
A breakout requires strong buying or selling interest. If the price moves beyond an important level without significant participation from market participants, the move may not be sustainable. For instance, a stock may break above resistance, but if trading volume remains low, it suggests that buyers are not fully supporting the move. As a result, prices may reverse quickly.
Stop-Loss Hunting
One common reason for false breakouts is stop-loss hunting. Many retail traders place stop-loss orders near obvious support and resistance levels. Large market participants and institutional traders are aware of these levels. Sometimes, prices are pushed slightly beyond support or resistance to trigger these stop-loss orders. Once sufficient liquidity is created, the market reverses direction, leaving many traders trapped.
News and Event-Driven Volatility
Major events often create short-term volatility in financial markets.
Examples include:
- RBI policy announcements
- Union Budget updates
- Corporate earnings releases
- Global economic data
- Geopolitical developments
Such events can trigger sudden price movements that initially appear to be genuine breakouts but later reverse once market sentiment stabilises.
Emotional Trading
Fear and greed play a significant role in market behaviour. Traders often enter positions immediately after a breakout because they fear missing a large move. This emotional response can temporarily push prices further in the breakout direction. However, if the move is not supported by strong fundamentals or market participation, the price may reverse.
Algorithmic Trading Activity
Modern markets are increasingly influenced by algorithmic and high-frequency trading systems. These systems can create temporary price spikes around important technical levels, increasing the likelihood of false breakouts.
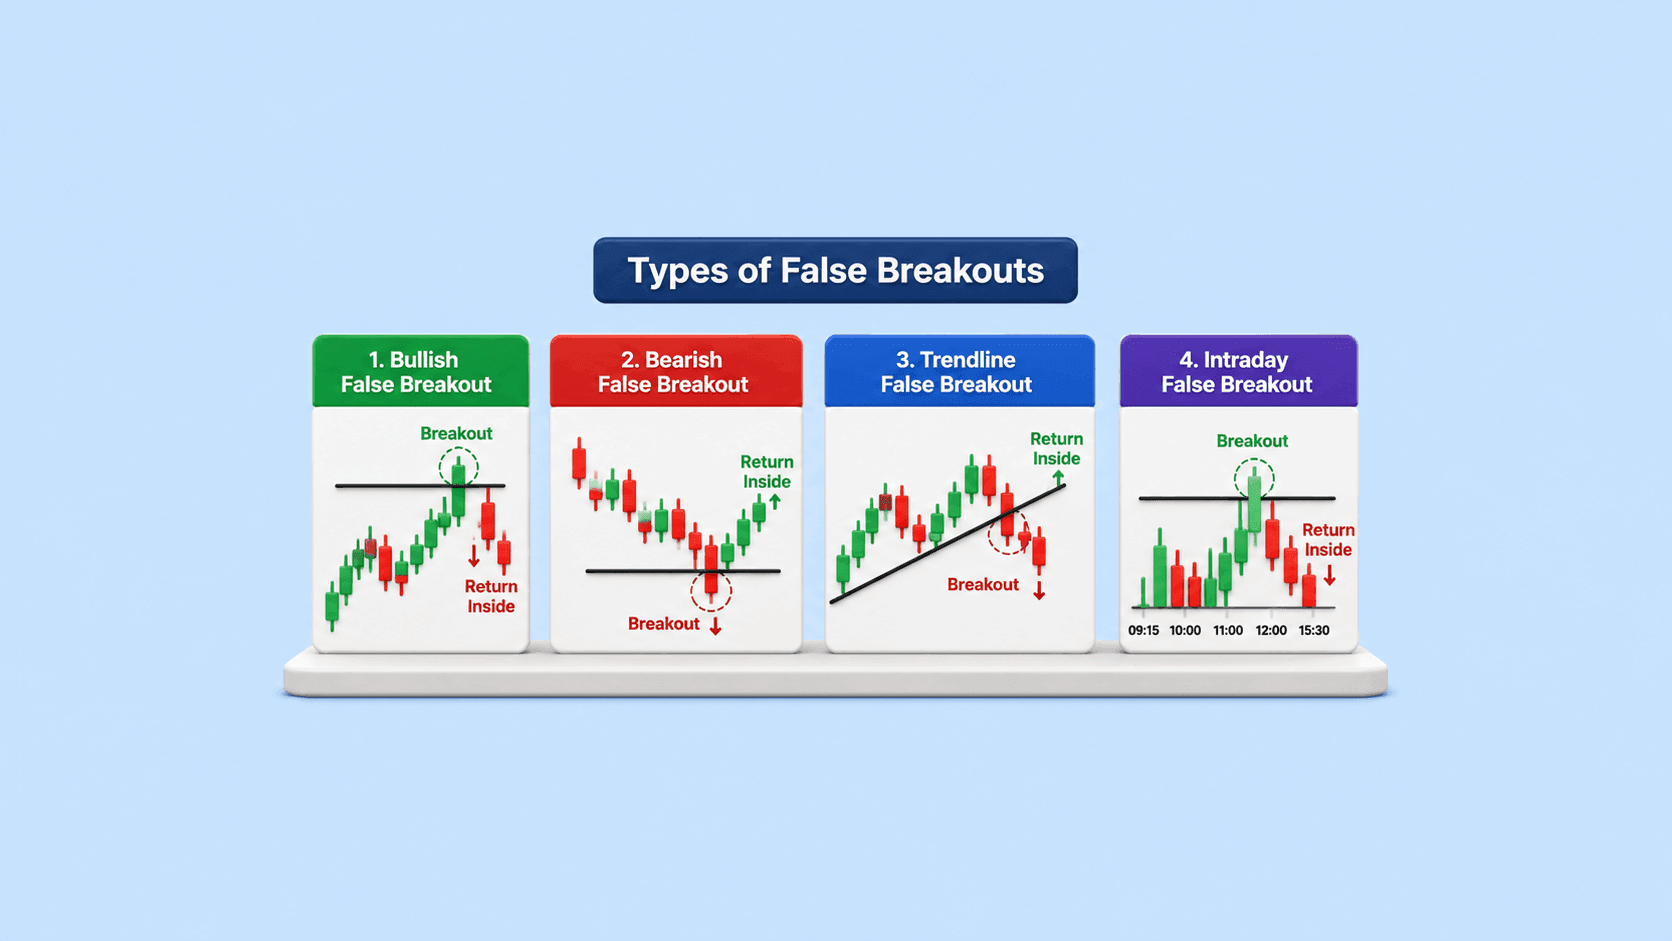
Types of False Breakouts
False breakouts can occur in different forms depending on market conditions and the technical levels involved.
Bullish False Breakout:
A bullish false breakout occurs when the price moves above a resistance level but fails to sustain the breakout and falls back below resistance.
For example, if a stock breaks above ₹800 and reaches ₹820 but later falls back to ₹780, the breakout has failed. This often traps traders who bought the stock expecting further upside.
Bearish False Breakout:
A bearish false breakout occurs when the price falls below a support level but quickly recovers and moves back above support. Suppose a stock falls below ₹500 and reaches ₹490. Traders may assume a downtrend has begun and sell their positions. If the stock quickly rebounds to ₹520, the breakdown is considered false.
Trendline False Breakout:
Trendlines are widely used in technical analysis to identify trends. Sometimes, prices temporarily move above or below a trendline before returning to the original trend direction. Such movements create false breakout signals and can mislead traders into entering premature trades.
Chart Pattern False Breakout:
False breakouts can occur in popular chart patterns such as:
- Triangles
- Rectangles
- Flags
- Pennants
- Head and Shoulders
The price may appear to confirm the pattern breakout initially but later reverse and invalidate the signal.
Intraday False Breakout:
Intraday traders frequently encounter false breakouts during volatile trading sessions. Prices may move beyond support or resistance during the day but fail to hold those levels by market close. This is particularly common in highly traded stocks and derivatives.
How to Identify a False Breakout
Learning how to identify false breakout situations is an important skill for traders. While no method can guarantee accuracy, certain indicators can improve the probability of identifying failed breakouts.
Observe Trading Volume
Volume is one of the most reliable indicators for assessing breakout strength. A genuine breakout is often accompanied by a noticeable increase in trading volume. Higher volume indicates strong participation and confidence among traders.
If a stock breaks above resistance but volume remains weak, the breakout may not be sustainable and could turn into a false breakout.
Wait for Candle Close Confirmation
Many beginners enter trades as soon as the price crosses a key level. Experienced traders often wait for the candle to close before confirming the breakout.
For example, if resistance is located at ₹1,000 and the stock briefly reaches ₹1,020 during the day but closes below ₹1,000, the breakout may have failed. Waiting for confirmation can help reduce false signals.
Monitor Retests
A strong breakout often revisits the breakout level before continuing in the new direction.
For example:
- Resistance at ₹500
- Breakout to ₹520
- Price returns to ₹500
- Support holds
- Price resumes upward movement
If the retest fails and the price falls below ₹500 again, it may indicate a false breakout.
Use Multiple Time Frames
One effective way to learn how to find false breakout opportunities is by analysing multiple time frames. A breakout visible on a 15-minute chart may not appear significant on a daily chart. Checking higher time frames can help traders determine whether the breakout has broader market support.
Watch Momentum Indicators
Technical indicators such as:
- Relative Strength Index (RSI)
- Moving Average Convergence Divergence (MACD)
- Stochastic Oscillator
Can provide additional confirmation. Weak momentum during a breakout often indicates a higher probability of failure.
Assess Overall Market Conditions
Breakouts aligned with broader market trends generally have a higher chance of success.
For example, if the Nifty 50 is experiencing strong selling pressure, a bullish breakout in an individual stock may be less reliable.
How to Avoid False Breakouts
Although no trader can eliminate false breakouts, several practical techniques can reduce their impact.
Avoid Entering Immediately-
One of the simplest ways to reduce false signals is to avoid entering a trade immediately after a breakout occurs. Waiting for confirmation allows traders to assess whether the breakout has genuine strength.
Look for Volume Confirmation-
Always verify whether volume supports the breakout. A breakout accompanied by strong volume is generally more reliable than one occurring on low participation.
Wait for a Retest-
Many professional traders prefer entering after a successful retest of the breakout level. While this approach may result in slightly later entries, it often improves trade quality and reduces the risk of getting trapped.
Use Stop-Loss Orders-
Risk management is a crucial component of every false breakout trading strategy. A properly placed stop-loss helps limit losses if the breakout fails unexpectedly. Traders should place stop-loss levels based on technical analysis rather than emotions.
Trade in the Direction of the Trend-
Breakouts that align with the prevailing market trend tend to be more reliable.
For example:
- Bullish breakouts during an uptrend
- Bearish breakouts during a downtrend
Often have a higher probability of success.
Avoid Trading During Uncertain Events-
Major economic announcements and corporate events can create temporary volatility and misleading price movements. Waiting for market reactions to stabilise can reduce the likelihood of entering false breakouts.
Follow a Structured Trading Plan-
Successful traders often rely on a documented false breakout trading strategy that includes:
- Entry criteria
- Volume requirements
- Stop-loss rules
- Profit targets
- Risk-reward ratios
Some traders maintain a personal false breakout trading strategy PDF to review their trading rules and improve consistency over time.
Conclusion
Understanding the false breakout meaning can help traders avoid misleading market signals and improve their trading decisions. While breakouts can indicate the start of a new trend, some fail to sustain momentum and quickly reverse direction.
Knowing what a false breakout in trading is and how to identify false breakout situations through volume analysis, confirmation, and retests can help reduce unnecessary losses. By following a disciplined false-breakout trading approach and proper risk management, traders can focus on higher-quality opportunities and improve long-term trading performance.
FAQs
How do you detect a false breakout?
A false breakout can be detected by analysing weak trading volume, failed candle close confirmation, unsuccessful retests, and rapid price reversals after crossing key support or resistance levels.
What is the difference between a consolidation and a false breakout?
Consolidation is a phase where prices move within a defined range. A false breakout occurs when the price temporarily exits that range but quickly returns, indicating that the breakout attempt has failed.
How do you trade fake breakouts?
Traders often wait for confirmation that a breakout has failed and then take positions in the opposite direction. Proper risk management and stop-loss placement remain essential.
Why are false breakouts common?
False breakouts are common because of market psychology, stop-loss hunting, low liquidity, algorithmic trading activity, and short-term reactions to news events.
What causes fake breakouts in stocks?
Fake breakouts can be caused by low trading volume, lack of strong buying or selling interest, institutional activity, sudden market news, and emotional trading behaviour.
Can false breakouts be avoided?
False breakouts cannot be completely avoided. However, traders can reduce their impact by waiting for confirmation, analysing volume, using stop-loss orders, and following a disciplined trading strategy.
Disclaimer: This article is intended for educational purposes only and should not be considered investment or trading advice. Investments in securities markets are subject to market risks. Please conduct your own research or consult a qualified financial advisor before making investment decisions.
Related Blog
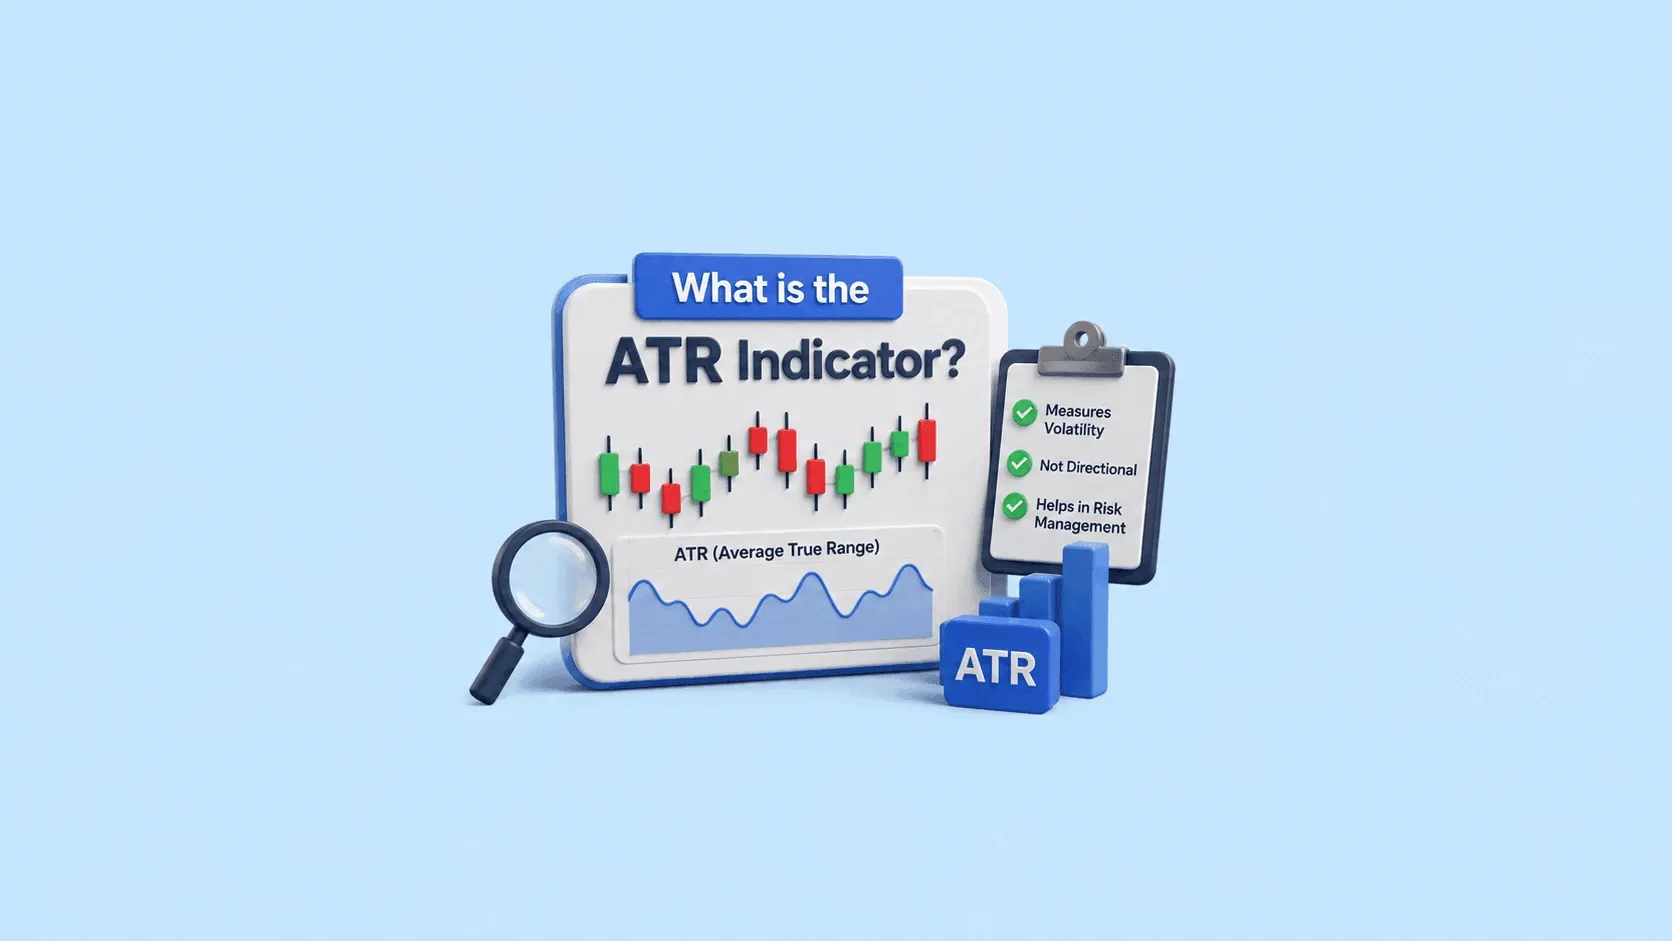
If you’re a trader whose technical analysis involves watching price movement, there is one indicator you should understand: the Average True Range. Unlike most indicators that focus on where the price is moving, ATR focuses on how much it is moving and how volatile the market can prove to be. In this guide, we will cover what Average True Range is, how it is calculated, and how it can be used to make smarter trading decisions. What is the ATR (Average True Range) Indicator? Average True Rang
16 July 2026

When you place a buy or sell order in the stock market, you may notice different order types offered by your broker. One such order type is the IOC order. Understanding what is IOC in the stock market can help you execute trades more efficiently, especially when prices change quickly. Whether you're a beginner or an active trader, knowing the IOC full form, how it works, and when to use it can help you make better trading decisions in the Stocks market. What is IOC? The IOC (Immediate or Can
16 July 2026

FII DII Data Today 16th July 2026 CATEGORY DATE BUY VALUE (₹ Crores) SELL VALUE (₹ Crores) NET VALUE (₹ Crores) DII 16-July-2026 17,192.66 14,825.78 2,366.88 FII 15-July-2026 13,013.48 16,460.66 -3,447.18 What are FII and DII in the Stock Market Foreign Institutional Investors (FIIs) invest in the Indian stock market from international markets, while Domestic Institutional Investors (DIIs) include mutual funds and institutional bodies operating from India. fii dii data helps tra
15 July 2026
Made for Traders.
Trusted by Investors.
Download FinX — trade confidently, invest
smarter, track everything.
