

If you’re a trader whose technical analysis involves watching price movement, there is one indicator you should understand: the Average True Range. Unlike most indicators that focus on where the price is moving, ATR focuses on how much it is moving and how volatile the market can prove to be.
In this guide, we will cover what Average True Range is, how it is calculated, and how it can be used to make smarter trading decisions.
What is the ATR (Average True Range) Indicator?
Average True Range (ATR) is a technical indicator that measures market volatility. In simple terms, it tells you how much a stock, index, or any other asset typically moves over a given period, usually 14 days. TR was developed by J. Welles Wilder Jr. and introduced in his 1978 book New Concepts in Technical Trading Systems.
An ATR indicator doesn't tell you the direction of price movement. It doesn't say whether a stock will go up or down. It simply tells you how much it has been moving recently, giving traders an idea of the asset's typical level of volatility.
A high ATR means the market is volatile and prices are swinging widely. A low ATR means the market is relatively calm and prices are moving in a more controlled, narrow range.
Understanding True Range
Before understanding ATR, you need to understand True Range (TR). Normally, to measure how much a stock moved in a day, you'd just subtract the day's low from its high. But this misses something: what happened overnight.
Imagine a stock closes at ₹500. The next morning, before trading even starts, some big news comes out and it opens at ₹520. That ₹20 jump happened while the market was shut; no trading captured it, but the price still moved. If you only look at that day's high and low, you might completely miss this jump.
True Range fixes this by asking three questions and picking whichever gives the biggest number:
- Current High - Current Low (How wide was today's actual trading range?)
- Current High - Previous Close (If today opened much higher than yesterday closed, how big was that jump?)
- Previous Close - Current low (If today opened much lower than yesterday closed, how big was that drop?)
Whichever of these three is the largest becomes the True Range for that day.
How is ATR Calculated?
Understanding the ATR formula helps explain how the indicator measures market volatility.
Once you have the True Range for each day, you can calculate the ATR by taking the average of the True Range values over a selected period, which is typically 14.
Step 1: Calculate the True Range for each of the last 14 days using the method described above.
Step 2: For the first ATR value, take a simple average of the first 14 True Range values:
First ATR = Sum of first 14 True Range values ÷ 14
Step 3: For all subsequent ATR values, use Wilder's smoothing formula:
ATR = [(Previous ATR × 13) + Current True Range] ÷ 14
In practice, you don't need to calculate this manually. Most modern trading platforms automatically calculate ATR. You simply add it as an indicator to your chart and read the value it shows.
What Does the ATR Indicator Tell You?
ATR tells you how much a stock or index is moving on average over a given period.
- It tells you about current market volatility: A rising ATR means volatility is increasing, the market is becoming more unpredictable and price swings are getting wider. A falling ATR means the market is calming down and moving in a tighter range.
- It tells you what a "normal" price move looks like: If Nifty has an ATR of 150 points, it means Nifty has been moving around 150 points on an average day. So if Nifty moves 100 points on a given day, there is nothing unusual about it. But if Nifty suddenly moves 400 points in a single day, that's nearly three times its average; something significant is clearly happening.
- It helps you size your trades appropriately. A stock with an ATR of ₹50 behaves very differently from one with an ATR of ₹5, even if both are trading at ₹500. The first stock can easily swing ₹50 in a day, which is important for deciding how many shares to buy and where to set your stop loss.
- It can help identify potential breakouts: When ATR has been very low for a while, it means the market is quiet and prices are barely moving and trading in a tight range. This quiet period is called consolidation. Prolonged consolidation tends to be followed by a sharp price move, either upward or downward. Traders often watch for a sudden increase in ATR alongside a price breakout as confirmation that market volatility is increasing.
How to Interpret ATR
ATR is relative. A ₹20 ATR means something very different for a ₹200 stock versus a ₹2,000 stock. For the ₹200 stock, that's a 10% daily swing, extremely volatile. For the ₹2,000 stock, it's just 1%, quite calm.
This is why some traders use ATR% (ATR divided by the current price, expressed as a percentage) to compare volatility across different stocks.
Rising ATR = increasing volatility. When ATR starts climbing, it means price swings are widening.
Falling ATR = decreasing volatility. When ATR drops and stays low, the market is in a quiet, consolidating phase. Prices aren't moving much.
Note: ATR doesn't indicate direction. A high ATR doesn't mean the market is going up or down. It simply means it's moving a lot.
Practical Uses of ATR in Trading
ATR plays a significant role in risk management because it helps traders adjust their trading decisions based on market conditions.
Some of its practical uses include:
1. Setting Stop Losses
The most common practical use of ATR is stop loss placement. A popular method is the ATR multiplier approach, multiplying the ATR by a factor (typically 1.5x or 2x) and placing your stop loss that distance away from your entry price.
For example, if you buy Nifty futures at 22,000 and the ATR is 150 points, a 1.5x ATR stop loss would be placed at 22,000 - 225 = 21,775.
2. Setting Profit Targets
ATR can also guide profit targets. If ATR is 150 points, expecting a 500-point move in a single session may not be realistic under normal market conditions. A target of 200 to 300 points, however, is just slightly above the average daily move, making it reasonable.
3. Identifying Breakouts
When ATR has been low for an extended period and then suddenly spikes upward, it often signals a breakout from consolidation. Traders watch for this ATR expansion as confirmation that a significant price move is beginning.
4. Position Sizing
Many traders divide their maximum risk per trade by the ATR-based stop-loss distance to determine position size. This keeps your risk per trade consistent regardless of how volatile different stocks are.
5. Trailing Stop Losses
ATR-based trailing stops adjust dynamically as the market moves. As the price moves in your favour, the trailing stop moves with it, always keeping the same ATR-based distance. This allows you to ride a trend while protecting profits.
Advantages of ATR
Key advantages of the Average True Range indicator include:
- Accounts for price gaps: Unlike simple high-low ranges, ATR captures overnight gaps and opening jumps, giving a more accurate picture of actual price movement.
- Universally applicable: ATR works across all asset classes: stocks, indices, commodities, currencies, and derivatives.
- Objective and data-driven: ATR removes guesswork from stop-loss placement and position sizing, replacing intuition with a number grounded in actual market behaviour.
- Easy to use: Despite the calculation behind it, ATR is available on every major charting platform with a single click, making it accessible to traders at all levels.
- Useful in all market conditions: Whether the market is trending strongly or moving sideways, ATR provides relevant information about how much it's moving.
Limitations of ATR
Despite its usefulness, ATR has certain limitations.
- Doesn't indicate direction: ATR tells you how much the market is moving, not where it's going. It must always be used alongside directional indicators for making trading decisions.
- Lagging indicator: Since ATR is based on historical price data, it reflects past volatility rather than predicting future volatility. A sudden news event can make the current ATR value immediately outdated.
- Not useful in isolation: ATR used alone is insufficient for making trading decisions. It works best when combined with trend analysis, support and resistance levels, volume indicators, or momentum indicators.
For example, knowing that a stock is moving ₹50 a day doesn't help you decide whether to buy it, sell it, or stay away. But combined with a directional indicator that says "this stock is in an uptrend," ATR helps you decide how much to risk and where to place your stop loss.
- Default period may not suit all traders: The standard 14-period ATR works well for swing traders, but day traders or long-term investors may need to adjust the period to suit their timeframe.
- Can be misleading during low-volume periods: ATR values during holidays, market closures, or very thin trading sessions may not accurately reflect true market volatility.
Conclusion
The Average True Range (ATR) is an important technical indicator that helps traders understand market volatility and manage risk more effectively. Rather than predicting market direction, ATR measures the magnitude of price movements, making it particularly useful for setting stop-loss levels, determining position sizes, and identifying changing market conditions.
Because it focuses solely on volatility, ATR is most effective when used alongside other technical analysis tools such as moving averages, trendlines, support and resistance, or momentum indicators. By incorporating ATR into their trading strategy, traders can make more informed decisions and better adapt to both calm and highly volatile markets.
FAQ
What is the ATR full form?
The full form of ATR is Average True Range.
What is ATR Formula
ATR = [(Previous ATR × 13) + Current True Range] ÷ 14
How do you use the Average True Range (ATR) indicator in trading?
ATR is primarily used for three purposes in trading: setting stop losses, sizing positions, and identifying breakouts.
The most common approach is to multiply the ATR by a factor of 1.5x or 2x and place your stop loss that distance from your entry point, giving the trade enough room to move without getting stopped out by normal volatility.
For position sizing, dividing your maximum acceptable loss per trade by the ATR value tells you how many shares or lots to buy.
When ATR is very low for an extended period and suddenly spikes, traders often use rising ATR alongside price action to confirm that a breakout may be gaining momentum.
How do you read ATR values?
ATR values are read in the same unit as the price of the asset, rupees for Indian stocks, points for indices like Nifty. An ATR of ₹50 on a stock means it has been moving an average of ₹50 per day over the measurement period.
Whether ATR is rising, falling, or holding steady tells you more than the number alone.
A rising ATR signals increasing volatility; a falling ATR signals a calming market. Always compare the current ATR with both the stock's price and its historical ATR values.
What is a good Average True Range?
There is no universally "good" ATR value because it varies across different stocks, indices, and other financial instruments. A high-priced stock naturally tends to have a higher ATR than a lower-priced stock. Instead of focusing on a specific number, traders compare the current ATR with the asset's historical ATR to determine whether market volatility is unusually high or low.
What is the best ATR period for trading?
The standard ATR setting is 14 periods, as introduced by J. Welles Wilder Jr. However, some traders use shorter periods, such as 7 or 10, for more responsive signals, while others prefer 20 or 21 periods for smoother readings.
Is a higher ATR better?
Not necessarily. A higher ATR simply indicates higher volatility. This may create more trading opportunities, but it also increases risk. Whether a high ATR is desirable depends on your trading strategy and risk tolerance.
Related Blog


Nifty Prediction For Tomorrow Indian equities remained under pressure on 21 October, with the Nifty closing at 22,811.35, down 77.60 points (-0.34%), marking its second consecutive session of decline. The index opened higher at 23,016, a gap-up of around 127 points, and initially advanced to an intraday high of 23,120.90 within the first half-hour. However, selling pressure emerged soon after the early rise and dragged the index down to an intraday low of 22,649.90. A late recovery helped the i
20 October 2026

The overall month has been quite unpredictable. While many on the chart stood strong, most of them have slipped. Bank Nifty on the other hand maintained its grip for a long time but now appears slightly bearish. Let’s see what the coming month holds for the investors as Mr. Sumeet Bagadia, Executive Director of Choice takes us through the weekly predictions of the market. Nifty Prediction For Next Week (19th October - 23th October 2026) The Nifty index started the week at 22,593.20, opening a
16 October 2026
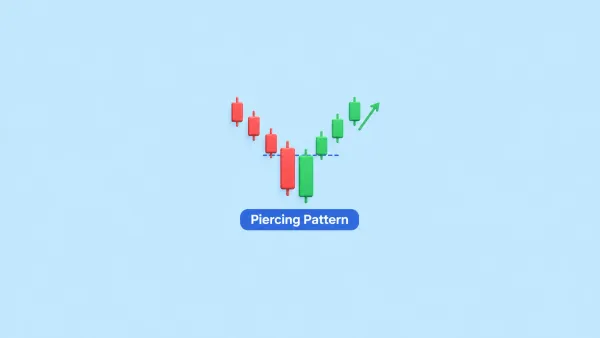
Understanding candlestick patterns can help traders study price movements and identify possible changes in market direction. One such pattern is the Piercing Pattern, which may signal a shift from selling pressure to buying pressure after a price decline. The pattern consists of two candles and is commonly used in technical analysis to identify a possible bullish reversal. However, it does not guarantee that prices will rise. Traders usually look for confirmation from the following candles, tr
14 October 2026
Made for Traders.
Trusted by Investors.
Download FinX — trade confidently, invest
smarter, track everything.

