
Stock charts may seem difficult to understand at first, especially when you’re just starting in the market. This is a common experience for many new investors across India, particularly from smaller cities and towns. However, once you learn a few basic patterns, these charts become much easier to read and begin to clearly reflect how prices move.
One such powerful and easy-to-understand pattern is the bull flag pattern. Traders commonly use it to spot opportunities where a stock may continue moving upward after a brief pause, making it a practical tool for understanding ongoing market momentum.
In this blog, we will break down what a bull flag pattern is, how it works in real life, and how even beginners can use it effectively with simple logic and examples.
What is A Bull Flag Pattern
The bull flag pattern is a continuation pattern, meaning it appears when a stock is already moving upward and is likely to continue in the same direction after a short pause. In simple terms, it shows a temporary break in the trend rather than a reversal. You can think of it like a runner who slows down briefly to catch their breath before continuing the race with the same momentum. Imagine an athlete running a marathon: they run fast for a few kilometres, stop for a quick sip of water, and then resume their race with renewed energy.
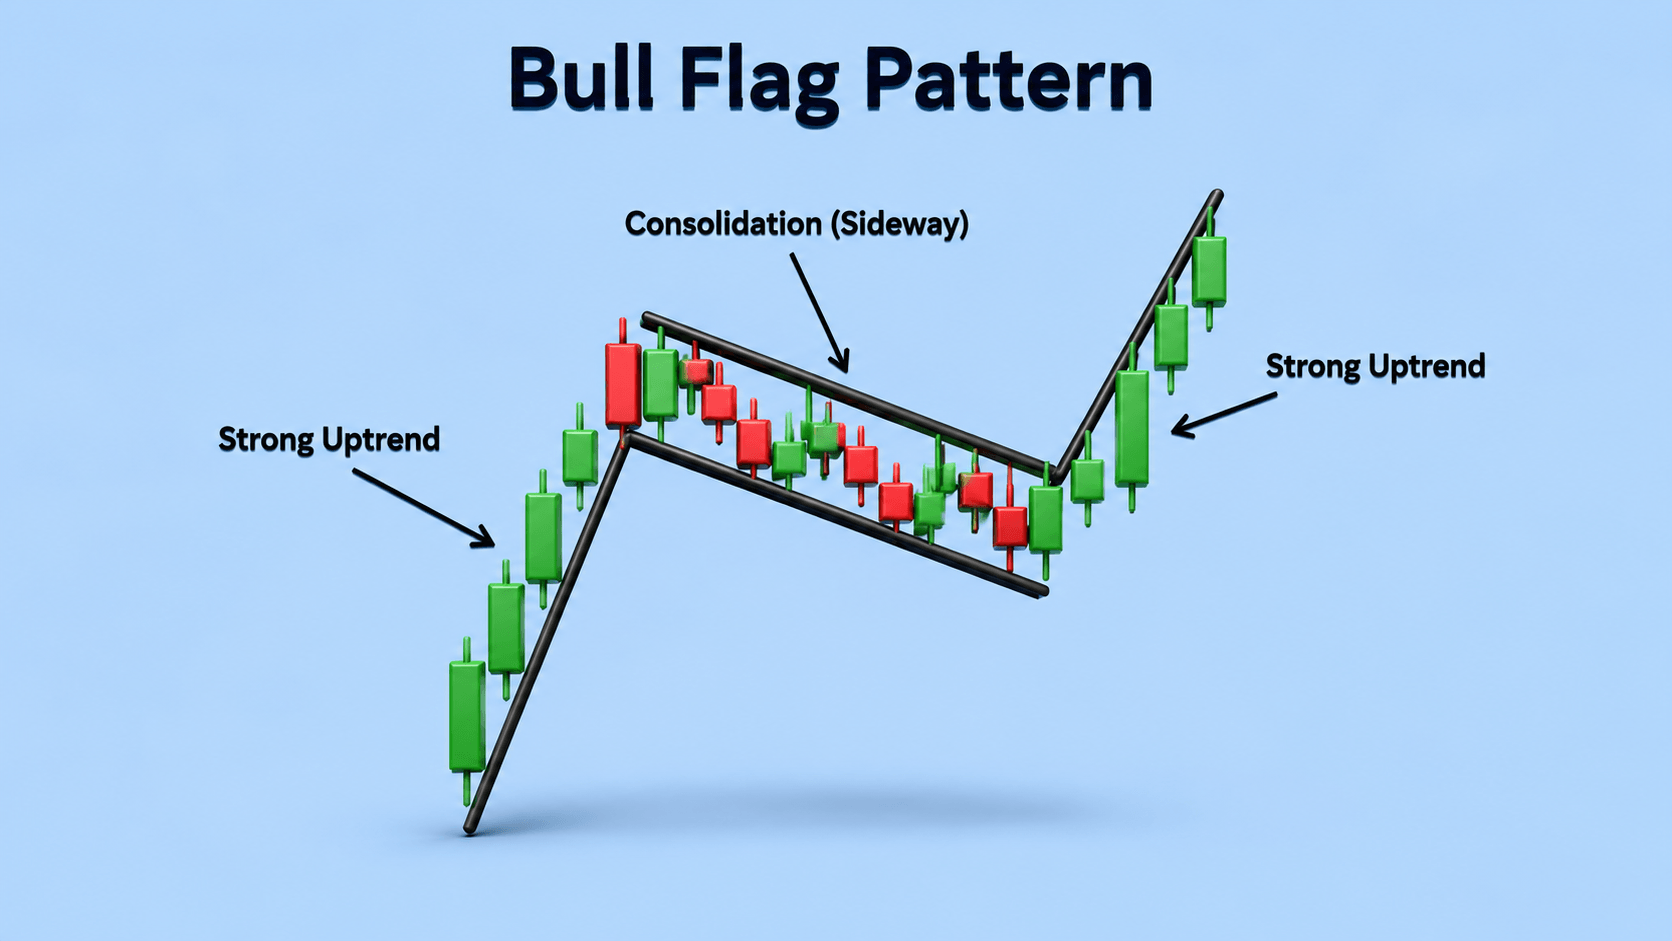
Visually, it looks exactly like its name suggests: a flag flying on a pole. In a candlestick pattern, where price movements are shown as red and green "candles," the pattern consists of two distinct phases:
- The Pole: A sharp, vertical surge in price.
- The Flag: A small, sloping downward or sideways rectangular box.
How to Identify a Bull Flag Chart Pattern?
To successfully identify a bull flag pattern, you don’t need expensive software; you just need to train your eyes to look for three specific components:
1. The Strong Uptrend (The Flagpole): This is the "momentum" phase. The stock should show a sudden, sharp move upward on high volume. For example, if a banking stock moves from ₹500 to ₹580 in just 3 or 4 days, that vertical move forms your "pole".
2. The Consolidation (The Flag): After the big move, some investors decide to book profits. This leads to a slight dip or sideways movement. The "flag" should be tight and controlled. If the price drops more than 50% of the pole's height, it’s likely not a bull flag but a trend reversal.
3. The Breakout: This is the moment of truth. When the price crosses above the upper boundary of the flag, it suggests the "sip of water" is over, and the stock is ready for its next big jump.
How to Use Bull Flag Candlestick Pattern in Trading
Using the bull flag pattern trading strategy is quite practical, even for beginners.
Step-by-step approach:
1. Identify the Pattern
Look for a strong upward move followed by a small consolidation.
2. Wait for Breakout
Do not enter early. Wait for the price to break above the flag.
3. Entry Point
Enter when the breakout happens with strong volume.
4. Stop Loss
Place stop loss below the flag’s lower boundary.
5. Target Price
You can estimate the target by measuring the flagpole height.
Example: If the pole was ₹20 high (e.g., ₹100 to ₹120) and the breakout happens at ₹118, your target would be approximately ₹138.
What Does a Bullish Flag Chart Pattern Indicate
A bullish flag chart pattern indicates:
- Strong buying interest in the stock
- Temporary pause, not a reversal
- Possibility of further upward movement
For retail investors, especially in Tier-2/3 cities where access to advanced tools may be limited, this pattern provides a simple visual way to understand market momentum without complex indicators.
It basically tells you: “The trend is strong, and buyers are still in control.”
Bull Flag Pattern Example
Let’s look at an example of a bull flag pattern in the Indian market context. Suppose a popular EV (Electric Vehicle) stock jumps from ₹1,000 to ₹1,200 due to a new government policy announcement. This ₹200 move is your flagpole.
Over the next week, the stock gradually slips to around ₹1,160 as some investors start booking profits. For a few days, it moves within a narrow range of ₹1,160 to ₹1,180, creating a small consolidation zone (the flag). Then, the price breaks above ₹1,185 with a sharp increase in trading volume. This breakout suggests that the stock may continue its upward move, with a possible target in the range of ₹1,360 to ₹1,385.
How a Bull Flag Pattern Forms
Understanding the "why" behind the "what" will make you a better investor. A bull flag forms because of a shift in human emotions:
1. Strong Buying Phase
Investors aggressively buy the stock, pushing prices higher.
2. Profit Booking
Some traders book profits, causing a small dip or sideways movement.
3. Fresh Buying
New buyers enter, seeing the dip as an opportunity.
4. Breakout
Demand increases again, and price moves higher.
Indicators to Confirm Bull Flag Pattern
While the visual pattern is great, you can use "confirmations" to be extra sure. Think of these as a second opinion from a doctor:
- Volume: Volume should be high on the pole, very low during the flag, and high again during the breakout.
- Moving Averages: If the stock is staying above its 20-day or 50-day Exponential Moving Average (EMA), the trend is very healthy.
- RSI (Relative Strength Index): If the RSI is above 50 but not yet at 80, there is still "room to run" before the stock becomes too expensive (overbought).
Conclusion
The bull flag pattern is one of the simplest and most effective tools in technical analysis. It helps traders identify opportunities where a stock may continue its upward journey after a short pause. This pattern is helpful for beginners who want a simple way to understand how stock prices move, without getting into complex technical concepts or analysis.
However, no pattern is 100% accurate. Always use proper risk management, avoid emotional decisions, and gradually build your understanding. Learning patterns like this is not just about trading, it is about becoming a smarter and more confident investor.
FAQs
Is the Bull Flag Pattern Reliable?
Yes, the bull flag pattern is considered reliable when identified correctly and supported by volume and indicators. However, like any strategy, it is not foolproof.
What Timeframe Works Best for the Bull Flag Pattern?
It works on all timeframes. "Day traders" use 5-minute or 15-minute charts. For "Swing traders" (who hold stocks for a few days/weeks), the Daily or 4-hour charts are usually the most accurate and less "noisy."
How to Identify a Valid Bull Flag?
Look for a nearly vertical "pole" and a "flag" that doesn't drop more than 38% to 50% of the pole's height. If the flag looks like it's falling apart or is very "messy," stay away.
What Is the Success Rate of the Bull Flag Pattern?
The success rate varies depending on market conditions and confirmation signals. Generally, with proper confirmation, traders consider it a high-probability setup, but never guaranteed.
Disclaimer: This content is for educational purposes only and not investment advice. Stock market investments are subject to market risks. Please do your own research or consult a financial advisor before investing.
Related Blog

FII DII Data Today 30th July 2026 CATEGORY DATE BUY VALUE (₹ Crores) SELL VALUE (₹ Crores) NET VALUE (₹ Crores) DII 30-July-2026 15,912.09 17,522.40 -1,610.31 FII 30-July-2026 16,026.05 12,937.37 3,088.68 What are FII and DII in the Stock Market Foreign Institutional Investors (FIIs) invest in the Indian stock market from international markets, while Domestic Institutional Investors (DIIs) include mutual funds and institutional bodies operating from India. fii dii data helps tra
29 July 2026

Nifty Prediction For Tomorrow The Nifty 50 tomorrow market prediction indicates a Sideways to Bullish trend. The range is between 24150 and 24500, with support at 24150-24200 and resistance at 24450-24500. Traders should monitor these crucial levels closely for potential market shifts. Nifty 50 Share Price * Nifty Support: 24150-24200 * Nifty Resistance: 24450-24500 * BIAS: Sideways to Bullish Nifty Range 24150 24500 Indian equity benchmark Nifty 50 ended the session on a posi
29 July 2026

Nifty Prediction Today Today, Nifty 50 prediction suggests a Sideways to Bullish range between 24150 and 24500, with strong support at 24150-24200 and resistance at 24450-24500 Traders should monitor these crucial levels closely for potential market shifts. Nifty Support and Resistance Level Today * Nifty Support: 24150-24200 * Nifty Resistance: 24450-24500 * BIAS: Sideways to Bullish Nifty Range 24150 24500 Indian equity benchmark Nifty 50 ended the session on a positive note,
29 July 2026
Made for Traders.
Trusted by Investors.
Download FinX — trade confidently, invest
smarter, track everything.
