
Natural Gas Price Prediction for Next Week (20th July - 24th July 2026)
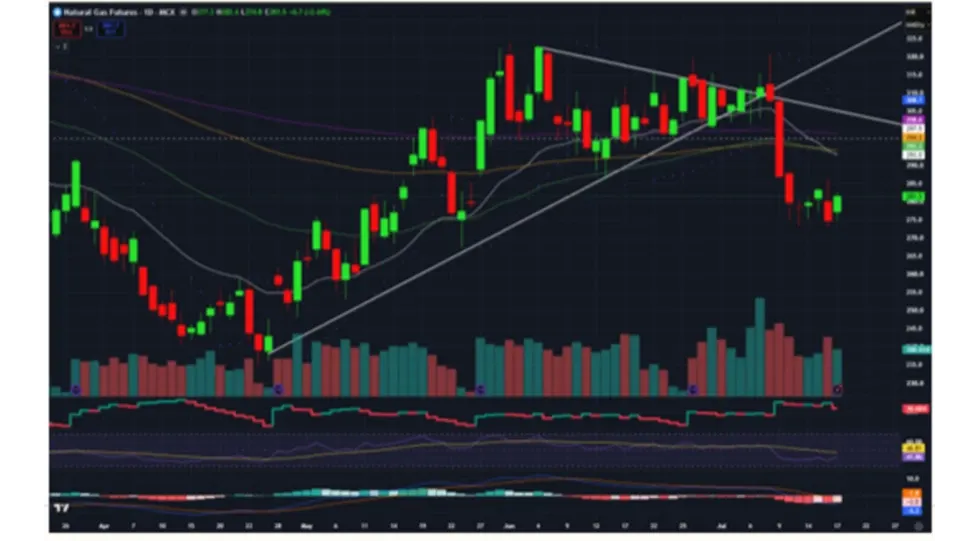
| Support 2 | Support 1 | CMP | Resistance 1 | Resistance 2 |
|---|---|---|---|---|
| 257.90 | 270 | 281.50 | 298.50 | 308.10 |
NYMEX Natural Gas prices declined around 2% this week, underperforming other energy benchmarks as abundant domestic supply offset the impact of rising geopolitical tensions in the Middle East. US gas inventories increased by 41 billion cubic feet in the week ended July 10, supported by stronger-than-expected storage injections. Ongoing outages at the Freeport LNG export facility in Texas limited export flows, leaving more gas available for the domestic market. Production in the Lower 48 states also edged higher to 110.2 bcf per day in July, while near-record solar and wind power generation reduced demand for gas-fired electricity. However, prices emained under pressure despite escalating US-Iran tensions disrupted tanker movements through the Persian Gulf. Supply concerns intensified after Qatar suspended expansion plans following an attack on one of its LNG tankers near the Strait of Hormuz, keeping European and Asian gas markets well supported.
Natural gas price has traded back & forth over the course of the week, settled on slightly positive bias at 281.50, up by +0.61%. After a drop of last week, the price has consolidated in between the 275 to 285 range this week. On the upside, crucial resistances would be at 50 and 200-DEMA levels placed at 293.20 and 298.60, respectively. On the other side, Key support would be at 270. Along with a price consolidation, Ol level has fallen to 30,680 lots, suggesting position covering and no major buildup at current levels. RSI level remained to 40 - 45 on Daily as well as Weekly chart.
We are expecting Sideways trend in Natural gas in the upcoming week and traders may look for breakout of either side level for trade opportunity.
Gold Price Forecast for Next Week: Get the latest prediction for gold prices to guide better investment decisions.
Crude Oil Price Forecast for Next Week: Explore the anticipated price range for crude oil in the upcoming week.
Silver Price Prediction for Next Week: Stay informed with next week's forecast for silver prices to track market trends effectively.
Copper Price Forecast for Next Week: Prepare for the upcoming week with valuable insights into copper price movements.
Prediction given by Technical Research Team - Choice
Related Blog
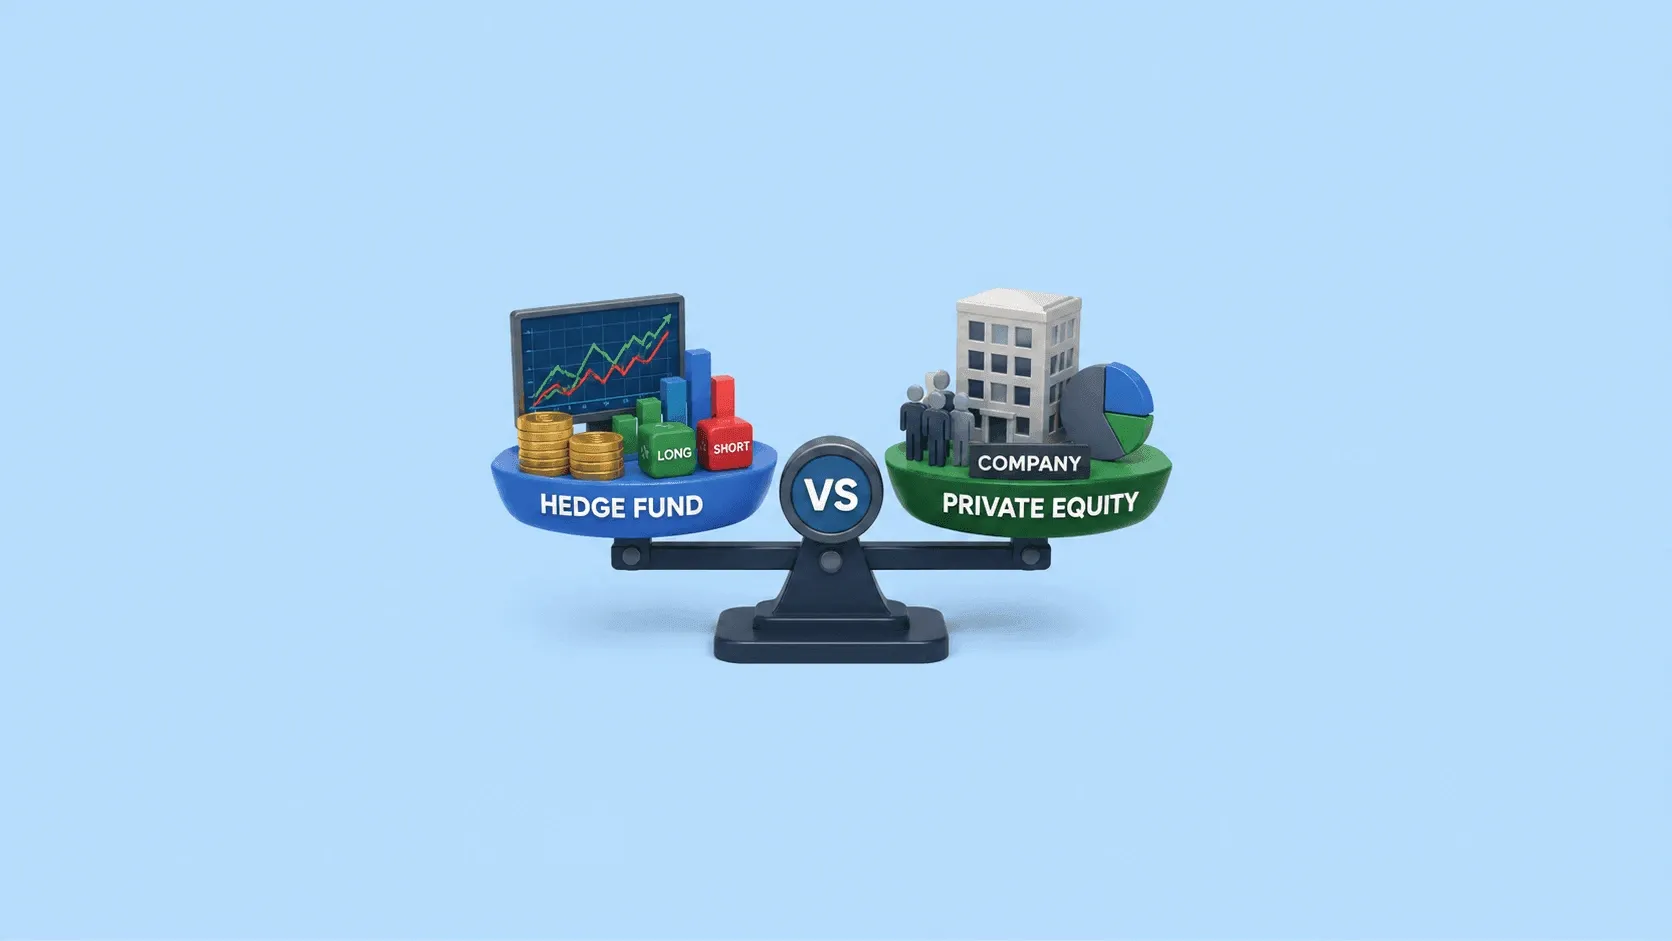
Many investors look beyond stocks and Mutual fund investments to explore alternative assets that may offer high return potential. Two popular options are hedge funds and private equity funds. While both are designed for sophisticated investors, they differ significantly in their investment approach, risk, and holding period. Understanding the hedge fund vs private equity comparison can help you make informed investment decisions. This guide explains the difference between hedge fund and private
20 July 2026
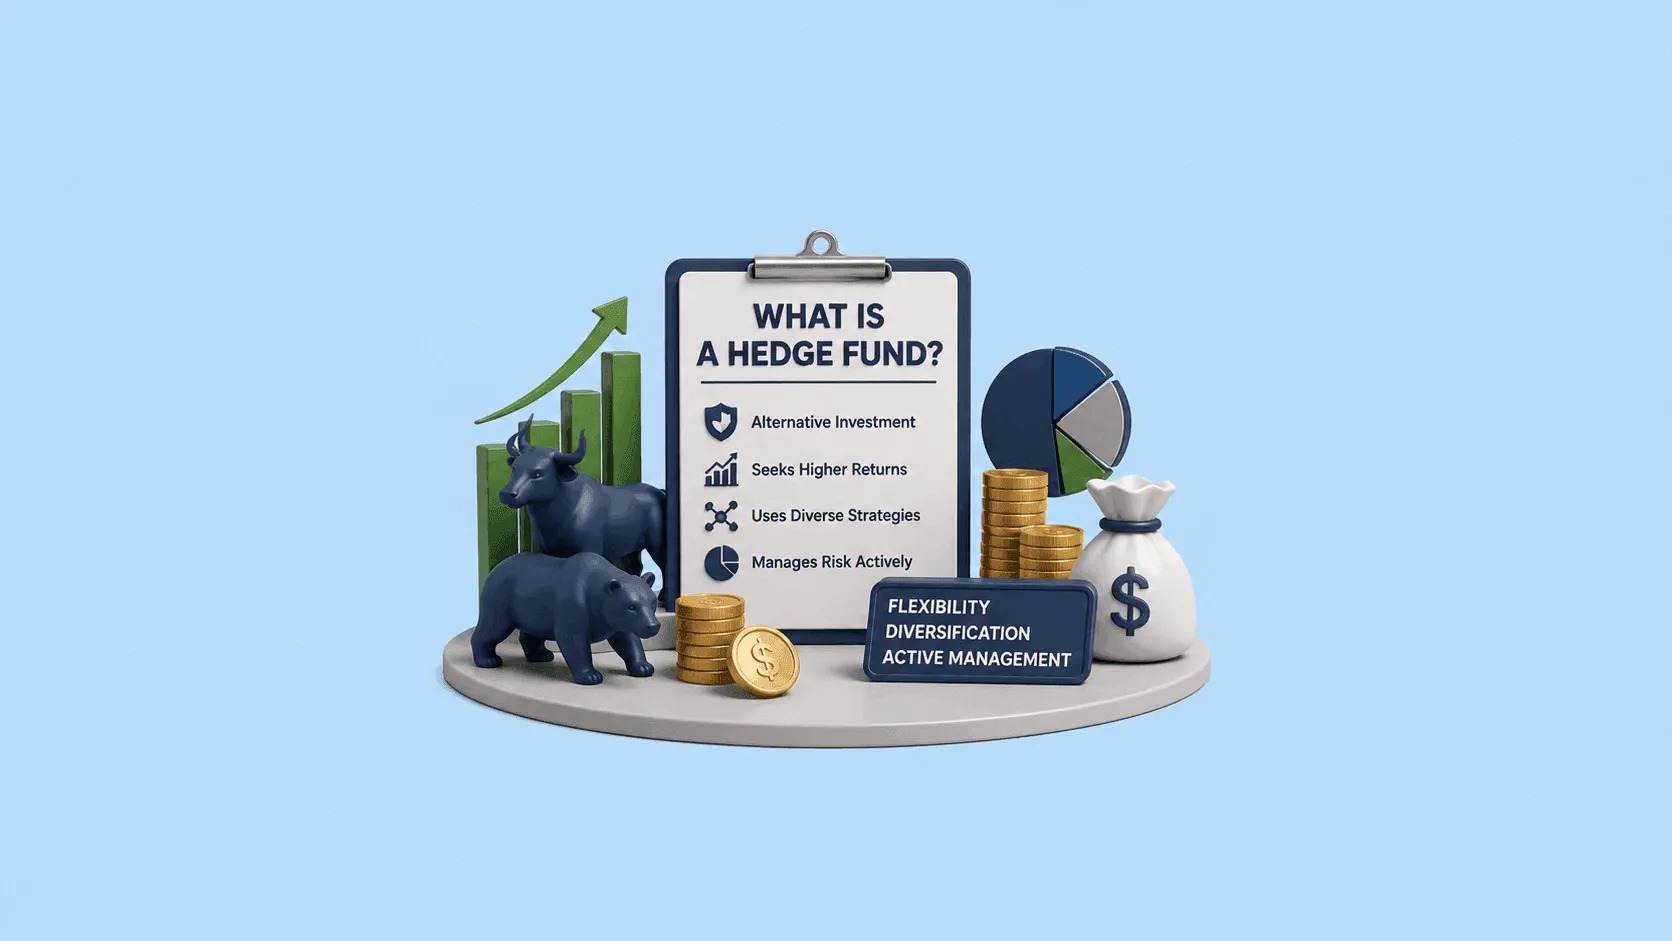
A hedge fund is an investment fund whose main purpose is to generate returns using complex investment strategies. If you are an investor, chances are you may have come across this term but may not have much idea about it, as this isn’t something that a normal investor interacts with directly. In this blog, you will learn the meaning of hedge funds, from their meaning to their types, advantages and disadvantages, and how they are taxed. Hedge Fund Meaning A hedge fund is a privately managed i
20 July 2026

FII DII Data Today 20th July 2026 CATEGORY DATE BUY VALUE (₹ Crores) SELL VALUE (₹ Crores) NET VALUE (₹ Crores) DII 20-July-2026 14,655.14 13,246.00 1,409.14 FII 20-July-2026 12,454.84 13,760.14 -1,305.30 What are FII and DII in the Stock Market Foreign Institutional Investors (FIIs) invest in the Indian stock market from international markets, while Domestic Institutional Investors (DIIs) include mutual funds and institutional bodies operating from India. fii dii data helps tra
19 July 2026
Made for Traders.
Trusted by Investors.
Download FinX — trade confidently, invest
smarter, track everything.
