
Gold Price Forecast for Next Week (27th July - 31st July 2026)
| Support 2 | Support 1 | Current GOLD CMP | Resistance 1 | Resistance 2 |
|---|---|---|---|---|
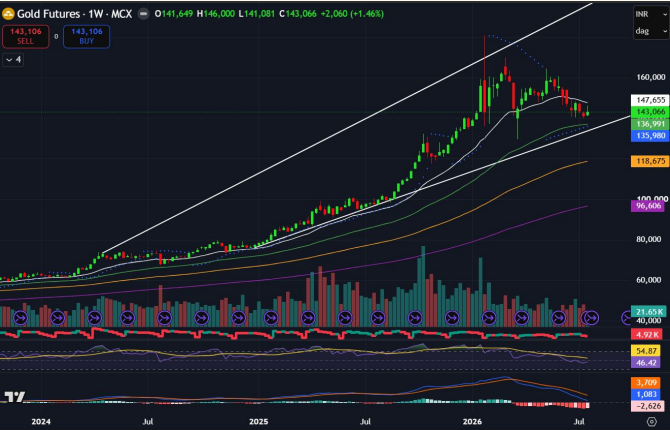
| 139,500 | 141,212 | 143,066 | 144,200 | 147,200 |
COMEX weekly Gold prices closed around 4,050 per ounce after declining nearly 2% last week, as investors assessed Middle East developments and their implications for inflation and US monetary policy. Elevated crude oil prices, driven by concerns over potential Gulf supply disruptions, strengthened expectations that interest rates could remain higher for longer, weighing on demand for non-yielding gold. The US Dollar Index eased to 101.3 after touching a one-month high of 101.5 on July 23, while the European Central Bank kept interest rates unchanged but signaled the possibility of a September hike. Markets now await next week's Federal Reserve meeting, with rates expected to remain unchanged and an 80% probability of a September rate hike still priced in. In Asia, gold discounts in India widened to a seven-week high, while demand improved in China. Markets will also monitor key US, Eurozone and Japanese economic data in upcoming week.
Gold price has traded back & forth over the course of the week and posted slightly gains and managed to close at 143,066. Gold price has resumed past week with gapped up and traded in a upside direction, reaching high at 146,000 in mid-week. However, price has failed to continue this pullback and retraced towards weekend. Price has settled over 200-DMA level placed at 141,212. On the upside, major resistance would be at 50-DEMA level placed at 147,200. Daily SAR is also placed at 146,034. RSI level has been trailing around 45 on Daily as well as Weekly chart.
The overall trend in Gold price is expected to be Moderately Bearish in the coming week, and traders should keep an eye on key US economic data such as Advance GDP, PCE Price index, Consumer sentiment and Unemployment claims along with Interest rate announcement by Fed Reserve which are scheduled to be release in the next week.
Related Stories
Silver Price Prediction for Next Week: Get next week's latest silver price prediction for border investment.
Natural Gas Price Prediction for Next Week: Check out the price range of natural gas for the next week.
Copper Price Forecast for Next Week: Stay ahead of market trends with next week’s copper price forecast!
Crude Oil Price Forecast for Next Week: Get ready with crude oil price insights for the week ahead!
Register to receive nifty prediction today, bank nifty prediction for tomorrow and Indian stock market prediction for next week, including range, support, and resistance levels.
Prediction given by Technical Research Team - Choice.
Made for Traders.
Trusted by Investors.
Download FinX — trade confidently, invest
smarter, track everything.
