
In the fast-paced world of intraday trading, timing and price precision are the difference between a winning trade and a missed opportunity. Traders often rely on technical indicators to identify entry and exit points, but few carry as much weight as the VWAP trading strategy.
Before you start clicking "buy" or "sell," you must clearly understand what VWAP in trading is, how it works, and how to use it effectively in real market conditions. In this guide, we will explore the complete concept, including its calculation, strategies, and limitations.
What Is VWAP In Trading Strategy?
The VWAP full form is "Volume Weighted Average Price". The meaning of VWAP in stock market terms is quite logical: it represents the average price of a stock throughout the trading day, weighted by the volume of shares traded at each price level.
VWAP in stock market trading is a cumulative intraday indicator that provides the "true" average price.
Unlike a simple moving average, it doesn't just look at the clock; it looks at the money.
- Price above VWAP: Indicates bullish sentiment (buyers are in control).
- Price below VWAP: Indicates bearish sentiment (sellers are in control).
How To Calculate VWAP?
Understanding the VWAP calculation is vital if you want to trust the signals it generates. Unlike indicators that lag behind, VWAP builds its data from the very first candle of the day. The following is the formula for VWAP:
VWAP = ∑(Price × Volume) / ∑ Volume
The top part of the VWAP formula represents the combined value of all trades during a selected time frame (price multiplied by volume), while the bottom part represents the total volume traded during that same period. In simple terms, it shows the average price of a stock after considering the quantity traded at each level.
On a price chart, the VWAP indicator appears as a single line that moves along with the stock price throughout the trading session. If the price stays above the VWAP line, it generally suggests that the stock is trading at a premium compared to its average price for the day. On the other hand, when the price falls below the VWAP line, it indicates that the stock is trading at a discount relative to its average.
Now, let’s talk about Anchored VWAP.
The calculation formula remains the same:
Anchored VWAP = ∑ (Price × Volume) / ∑ Volume
However, what makes it different is the starting point. Instead of beginning from the market open like the regular VWAP, Anchored VWAP allows traders to select a specific date or event as the starting point. For example, a trader might anchor it to a major news announcement, earnings release, breakout level, or any significant market event.
This flexibility helps traders analyze price behavior from a meaningful reference point, making Anchored VWAP especially useful for identifying trend strength, support, and resistance after important market events.
VWAP Strategy Explained
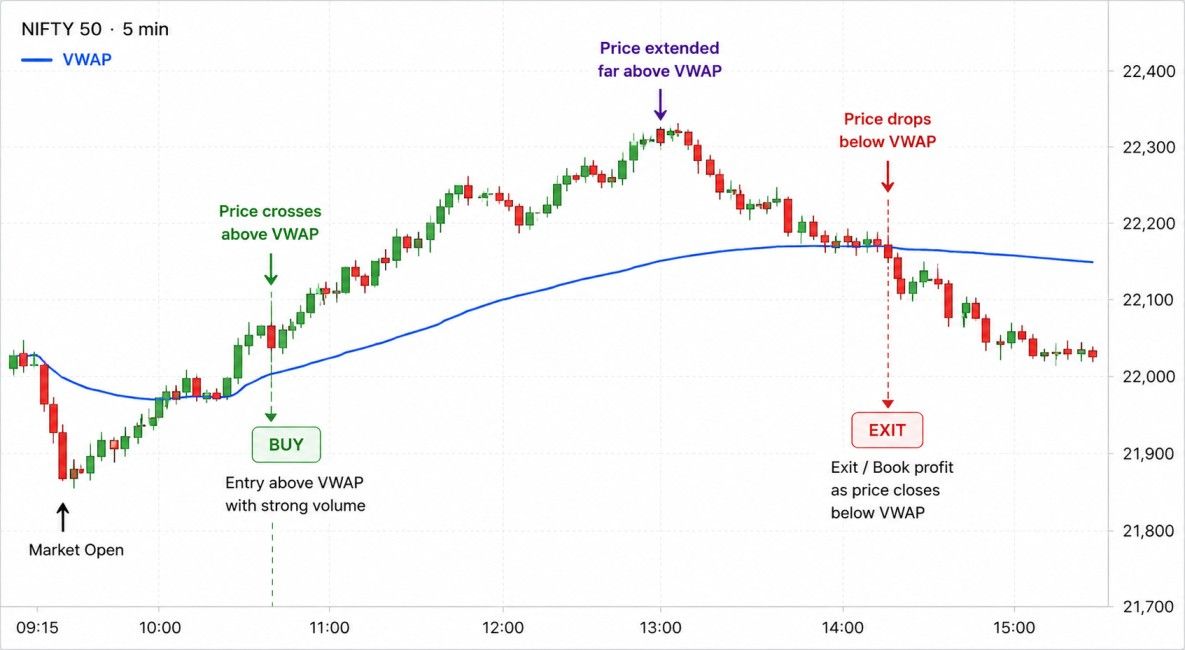
Now, let's look at what VWAP trading is in a practical, real-world sense. The core of any VWAP trading strategy is the interaction between the current price and the VWAP line.
- The Buy Signal: When the price breaks and sustains above the VWAP line with high volume, it suggests strong institutional buying.
- The Sell Signal: If the price drops below the line and fails to recover, it signals weakness and a potential short-selling opportunity.
- Dynamic Support & Resistance: In a trending market, the VWAP line often acts as a floor during pullbacks or a ceiling during rallies.
Types of VWAP Strategies
There isn’t just one single best VWAP strategy. Instead, traders adapt it to their style.
1. VWAP pullback strategy
Traders wait for the price to trend above VWAP and then pull back toward it before entering long positions.
2. VWAP breakout strategy
When the price breaks above or below VWAP with strong volume, traders enter the breakout direction.
3. VWAP reversal strategy
If the price deviates too far from VWAP, mean reversion traders expect it to return toward VWAP.
4. Multi-Timeframe VWAP strategy
Some traders use daily VWAP along with weekly or anchored VWAP for better context.
Each approach depends on market conditions, volatility, and your risk appetite.
Advantages & Disadvantages of VWAP Strategy
| Advantages of VWAP Strategy | Disadvantages of VWAP Strategy |
|---|---|
| Institutional Benchmark: Used by hedge funds and institutions. | Intraday Limitation: Standard VWAP resets daily. |
| Volume-Based Accuracy: Incorporates trading activity, not just price. | Lagging Nature: Based on historical data. |
| Clear Trend Bias: Helps identify bullish or bearish intraday bias. | Not Ideal for Long-Term Investing: Better suited for short-term trading. |
| Dynamic Support/Resistance: Acts as a real-time reference level. | False Signals in Low Volume Markets: Volume irregularities can distort VWAP. |
| Reduces Emotional Trading: Provides structure to entries and exits. |
How to Implement the VWAP Strategy
If you’re wondering how to use the VWAP indicator, follow this practical framework:
1. Open your trading platform.
2. Add the VWAP indicator to your intraday chart.
3. Observe whether the price is above or below VWAP.
4. Wait for pullbacks or confirmations.
5. Use stop-loss below VWAP for long trades and above VWAP for short trades.
6. Combine with volume analysis for stronger signals.
Risk management remains essential. Even the best VWAP strategy fails without discipline.
Example of VWAP Strategy
Example 1: Bullish Intraday Trend
A stock opens strong and stays above VWAP. It pulls back slightly toward VWAP but does not break below it. A trader enters long near VWAP and rides the trend upward.
Example 2: Bearish Breakdown
Price opens above VWAP but quickly falls below with strong selling volume. Trader enters short below VWAP and exits when price consolidates.
These examples show how the meaning of VWAP in stock market trading translates into actionable decisions.
Conclusion
To summarise, what is VWAP in stock market trading? It is the heartbeat of intraday price action. By mastering the meaning of VWAP in stock market contexts and understanding the nuances of VWAP calculation, you gain a significant edge over retail traders who only look at price.
While the VWAP trading strategy is powerful, remember it works best when combined with price action and disciplined risk management.
FAQs
What Is the Best VWAP Strategy?
The best VWAP trading strategy is usually the pullback strategy in a strong trend, combined with volume confirmation and proper stop-loss.
Can the VWAP Strategy Be Used for Long-Term Trading?
No, VWAP is primarily an intraday indicator because it resets daily. For long-term trading, moving averages are more suitable.
What Is VWAP, and How Is It Different From a Simple Moving Average?
VWAP includes volume in its calculation, while a simple moving average considers only price. This makes VWAP more accurate for intraday analysis.
What Is the Best VWAP Strategy?
A combination of VWAP breakout with volume confirmation and RSI filtering is considered effective by many traders.
Can VWAP Be Combined With Other Indicators?
Yes. VWAP works well with RSI, MACD, moving averages, and price action strategies for better trade confirmation.
Disclaimer: This article is for educational purposes only and does not constitute financial or investment advice. Trading involves risk, and you should consult a qualified financial advisor before making investment decisions.
Related Blog
Understanding what price action is among the first steps towards becoming a better trader. Instead of relying on multiple indicators, price action trading focuses on analysing a stock's price movement to identify potential trading opportunities. Since price reflects the balance between buyers and sellers, many traders use it to understand market sentiment and make informed decisions. Whether you're new to trading or looking to improve your analysis, learning about price action in the stock mark
22 July 2026

A Miniratna company is a type of government-owned company (Public Sector Undertaking or PSU) in India that the government has granted greater financial and operational autonomy. In simple words, these companies are allowed to take certain business decisions on their own without needing approval from the central government every time. The three-tier CPSE system looks like this: StatusApprox. CountFinancial AutonomyMaharatna14Highest — can invest up to ₹5,000 crore in a project without governmen
22 July 2026
If you're planning to invest in an IPO, it's important to understand the documents companies file before their shares become available to the public. One of the most important of these is the DRHP. Knowing what a DRHP is can help you learn more about a company's business, financial position, and potential risks before making an investment decision. What is DRHP? DRHP (Draft Red Herring Prospectus) is a preliminary document that a company files with the market regulator before launching its In
22 July 2026
Made for Traders.
Trusted by Investors.
Download FinX — trade confidently, invest
smarter, track everything.
