
Momentum trading is a popular short-term trading style where traders aim to profit from assets that are moving strongly in one direction. Understanding momentum trading meaning is essential for traders who want to capitalise on rapid price acceleration. Simply put, momentum trading focuses on jumping into a fast-moving trend and exiting before the momentum fades.
This blog breaks down what is momentum trading, how it works, popular strategies, and best practices backed by strong risk management.
What is the Momentum Trading Strategy?
Momentum Trading Meaning: Momentum trading involves buying an asset when its price is rising with strength and high volume and selling (or shorting) when its price is falling with conviction. This trading strategy operates on the core principle of trend persistence, meaning that assets with strong price movement in one direction are likely to maintain that trend for a measurable period before the trend concludes or reverses.
This approach allows traders to capitalise on current acceleration by:
1. Entering (Buying): Identifying and purchasing assets that exhibit strong, confirmed upward momentum, often backed by high volume.
2. Exiting (Selling): Closing the position once technical indicators or price action signal that the rate of movement is slowing or showing signs of exhaustion, thereby maximising gains before a potential reversal.
Many beginners confuse momentum trading with trend following, but they are not the same:
Momentum Trading vs Trend Following
- Trend Following → Focuses on the direction of price over a longer period. Traders may hold for weeks or months.
- Momentum Trading → Focuses on the speed and acceleration of price changes. Traders usually hold positions for hours or a few days, not for the long term.
A simple analogy: Momentum trading is like catching a moving train while it’s accelerating. You hop on as the speed increases and jump off before it slows.
How Does Momentum Trading Work?
Here’s a breakdown of how momentum trading works:
1. Identifying Strong Price Movement: Momentum traders start by scanning the market for stocks or assets that show:
- Sharp upward or downward price movement
- Strong acceleration (fast changes in price)
- Breakouts above resistance or below support
These conditions hint that traders and institutions are actively pushing the price in one direction.
2. Confirming Momentum With Indicators: Once a stock is moving fast, traders use momentum indicators to confirm the strength:
- RSI (Relative Strength Index): Momentum traders watch for the RSI crossing above 50 (bullish momentum) or below 50 (bearish momentum).
MACD & MACD Histogram:
- The MACD line crossing over the signal line shows a shift in momentum.
- The MACD histogram helps visualise whether momentum is increasing or weakening.
- Volume: High volume confirms that many traders are participating, making the momentum more reliable.
- Rate of Change (ROC): Measures how quickly the price changes over a given period. A rising ROC means increasing momentum.
3. Entering the Trade: Traders enter after confirming that momentum is real, not a fake breakout. Common entry points include:
- Price breaking above resistance with volume
- Price breaking below support with volume
- Gap-ups or gap-downs that hold
- Indicator confirmations (e.g., RSI > 50 or MACD histogram expanding)
Momentum traders do not try to catch bottoms or tops. They enter mid-move when the strength is already visible.
4. Setting Tight Stop-Losses: Momentum can reverse quickly, so risk management is critical. Typical stop-loss placements:
- Just below the breakout candle
- Below is a recent support/pivot point
- Using ATR-based volatility stops
The goal is simple: Cut losses quickly if momentum fails.
5. Riding the Momentum: Once in the trade, traders hold the position as long as momentum stays strong, watching:
- Volume
- Price speed
- Indicator strength (RSI, MACD histogram, ROC)
The moment momentum slows, shrinks, or reverses, traders prepare to exit.
6. Exiting the Trade: Momentum traders exit when:
- Indicators weaken (e.g., RSI dips below 50)
- MACD histogram shrinks
- Volume drops
- Price shows reversal candles
- A resistance/support level blocks further movement
Profit-taking is timed around momentum fading, not at predicting tops or bottoms.
Core Elements That Drive Momentum Trading
Momentum trading is built on a few key elements that help traders determine whether a price move is strong, reliable, and likely to continue.
1. Price Acceleration: Momentum trading is driven by how quickly the price of an asset is rising or falling. Traders focus on the sudden acceleration price because rapid acceleration often signals strong buying or selling pressure.
2. Trading Volume: High volume confirms that many market participants support the price move. Strong volume adds reliability to the momentum, indicating genuine interest behind the trend.
3. Market Volatility: Volatility creates opportunities for sharp and rapid price movements. Momentum traders thrive in active markets where prices fluctuate enough to generate short-term trading opportunities.
4. Market Sentiment: News events, earnings announcements, and overall market psychology can create strong sentiment-driven moves. Positive or negative sentiment often triggers the kind of momentum that traders aim to capture.
5. Breakouts and Price Levels: Momentum often builds when the price breaks above a resistance level or below a support level. These breakouts signal strength and can lead to fast continuation moves.
6. Technical Indicators: Indicators such as RSI, MACD, and ROC help traders identify the strength of momentum. These tools signal whether momentum is increasing or decreasing, helping traders make informed entry and exit decisions.
Key Characteristics of Momentum Traders
To trade momentum successfully, traders need certain characteristics that help them spot opportunities and stay disciplined:
- Quick Decision-Making: Momentum traders act fast because strong price moves can appear and disappear within minutes or hours. They are comfortable entering and exiting trades quickly when conditions change.
- Strong Technical Analysis Skills: These traders rely heavily on charts, indicators, and price action. They use tools such as RSI, MACD, moving averages, and volume patterns to identify momentum accurately.
- Discipline and Risk Management: Momentum traders follow strict rules for stop-loss placement and position sizing. They avoid emotional decisions and stick to predefined risk limits to protect capital from sudden reversals.
- Ability to Handle Volatility: Momentum trading often happens in fast-moving markets. Successful traders remain calm under pressure and adapt quickly when volatility increases.
- Focus on Liquidity: They prefer highly liquid stocks or assets because liquidity ensures quick entries and exits without large price slippage.
- Short-Term Mindset: Momentum traders focus on capturing rapid price acceleration rather than holding positions for long periods. Their approach is more immediate compared to traditional trend-following strategies.
Benefits vs. Risks of Momentum Trading
Before adopting momentum trading, it’s essential to understand both its strengths and its risks:
| Benefits of Momentum Trading | Risks & Challenges of Momentum Trading |
|---|---|
| Potential for rapid profits during strong price movements. | Sudden trend reversals can cause quick losses if momentum weakens (risk amplified by high volatility). |
| Works well for intraday and short-term swing trading, offering flexibility. | Emotional pressure from fast-paced markets can lead to impulsive decisions. |
| Provides clear entry and exit signals using tools such as RSI, MACD, and volume-based indicators. | High transaction costs due to frequent buying and selling. |
| Can be automated through algorithmic trading, reducing human error. | Gap risk, where overnight news causes unfavourable price jumps. |
| Ease of execution due to focusing on highly liquid stocks. | Requires constant monitoring of the market. |
Example of Momentum Trading
Imagine a stock that has been trading at ₹500 for several days. One morning, it opens with a strong gap-up at ₹530, supported by high trading volume. This sudden rise signals strong buying interest and accelerating momentum.
A momentum trader watches for confirmation using indicators:
- RSI jumps above 50, showing bullish strength.
- MACD histogram expands, indicating increasing momentum.
Once the price sustains above the breakout level, the trader enters a long position, expecting the strong upward movement to continue.
To manage risk, the trader places a stop-loss just below the breakout candle or uses an ATR-based stop to allow for volatility. As long as the price continues rising with strong volume, the trader holds the position.
When indicators show slowing momentum, such as falling volume or a shrinking MACD histogram, the trader exits and books a profit.
This momentum trading example shows how momentum traders aim to enter after strength is confirmed and exit as soon as momentum fades, capturing the most powerful part of the move.
Popular Momentum Trading Strategies
Momentum traders rely on several proven strategies to identify and capture strong price movements:
1. RSI Momentum Strategy:
Momentum traders use the RSI not just for overbought/oversold signals but for the 50-level crossover. When RSI moves above 50, it suggests bullish momentum, and when it dips below 50, it indicates bearish momentum. This helps traders confirm the strength behind a price move.
2. MACD Histogram Strategy:
The MACD histogram helps traders visualise changes in momentum. Expanding histogram bars signal strengthening momentum, while shrinking bars warn that momentum is fading. Traders use this to time entries and exits more accurately.
3. Breakout Trading Strategy:
Momentum often appears when the price breaks above resistance or below support with strong volume. Traders enter after the breakout is confirmed and ride the momentum as long as the price continues in the same direction.
4. Gap Trading Strategy:
Large gap-ups or gap-downs at market open can signal strong sentiment. If the price continues in the direction of the gap with sustained volume, momentum traders may enter early to capture the move.
5. Rate of Change (ROC) Strategy:
The ROC indicator measures how quickly the price is changing over a selected period. A rising ROC suggests accelerating momentum, while a falling ROC signals that the trend may be weakening.
6. Moving Average Crossover Strategy:
Momentum traders use short-term moving averages crossing above or below longer-term ones to identify momentum shifts. A bullish crossover signals upward momentum, while a bearish crossover suggests downward acceleration.
Best Practices for Momentum Traders
To improve consistency and avoid common mistakes, momentum traders rely on a few essential best practices:
- Use Strict Stop-Loss Orders: Momentum can reverse suddenly, so placing tight, logical stop-losses, such as below breakout levels or using ATR-based stops, is essential to protect capital
- Trade Highly Liquid Assets: High liquidity ensures smoother entries and exits with minimal slippage, which is important when trades move quickly.
- Focus on Volume Strength: Strong volume confirms genuine momentum. Traders should enter only when volume supports the price move and avoid low-volume breakouts.
- Avoid Trading Against the Trend: Even in short-term momentum trading, aligning trades with the broader market direction increases the probability of success.
- Monitor Key Indicators Closely: Tools like RSI, MACD histogram, and ROC help identify momentum shifts. Regular monitoring helps traders react before the trend weakens.
- Keep Emotions Out of Trading: Momentum trading requires fast decisions, and emotional reactions can lead to poor judgment. Following predefined rules improves consistency.
- Backtest and Refine Strategies: Testing strategies on historical data helps traders understand what works, what doesn’t, and how to improve their approach before risking real capital.
Conclusion
Momentum trading is a powerful approach for traders who can read trends, analyse charts, and manage risks effectively. It offers strong profit potential but requires discipline, timely decision-making, and a clear understanding of technical indicators. Whether you’re a beginner or an advanced trader, building a solid momentum strategy can help you trade more confidently in dynamic markets.
FAQs
1. What is the best time for momentum trading?
Momentum trading works best during high-volume market hours, typically the first and last hours of market sessions. In India, this is usually 9:15–10:30 AM and 2:30–3:30 PM.
2. Is momentum trading profitable?
Yes, it can be profitable if traders follow disciplined risk management, trade liquid stocks, and avoid emotional decision-making. However, profitability depends on skill, strategy, and market conditions.
3. Can momentum trading be applied to different timeframes in India?
Yes.. Momentum trading works across intraday, swing, positional, and even weekly timeframes. Choose a timeframe that suits your risk appetite.
4. Can algorithmic trading help in momentum trading?
Yes. Algorithmic trading can execute momentum strategies faster, remove emotional biases, and scan multiple assets simultaneously.
5. What is the difference between positive and negative momentum?
- Positive momentum: Prices are rising with strength.
- Negative momentum: Prices are falling consistently and may continue declining.
Both can offer trading opportunities depending on your strategy.
| Trading Topics |
|---|
| Paper Trading |
| Tick Trading |
| What is Positional Trading |
| Scalping Trading Strategy |
Related Blog
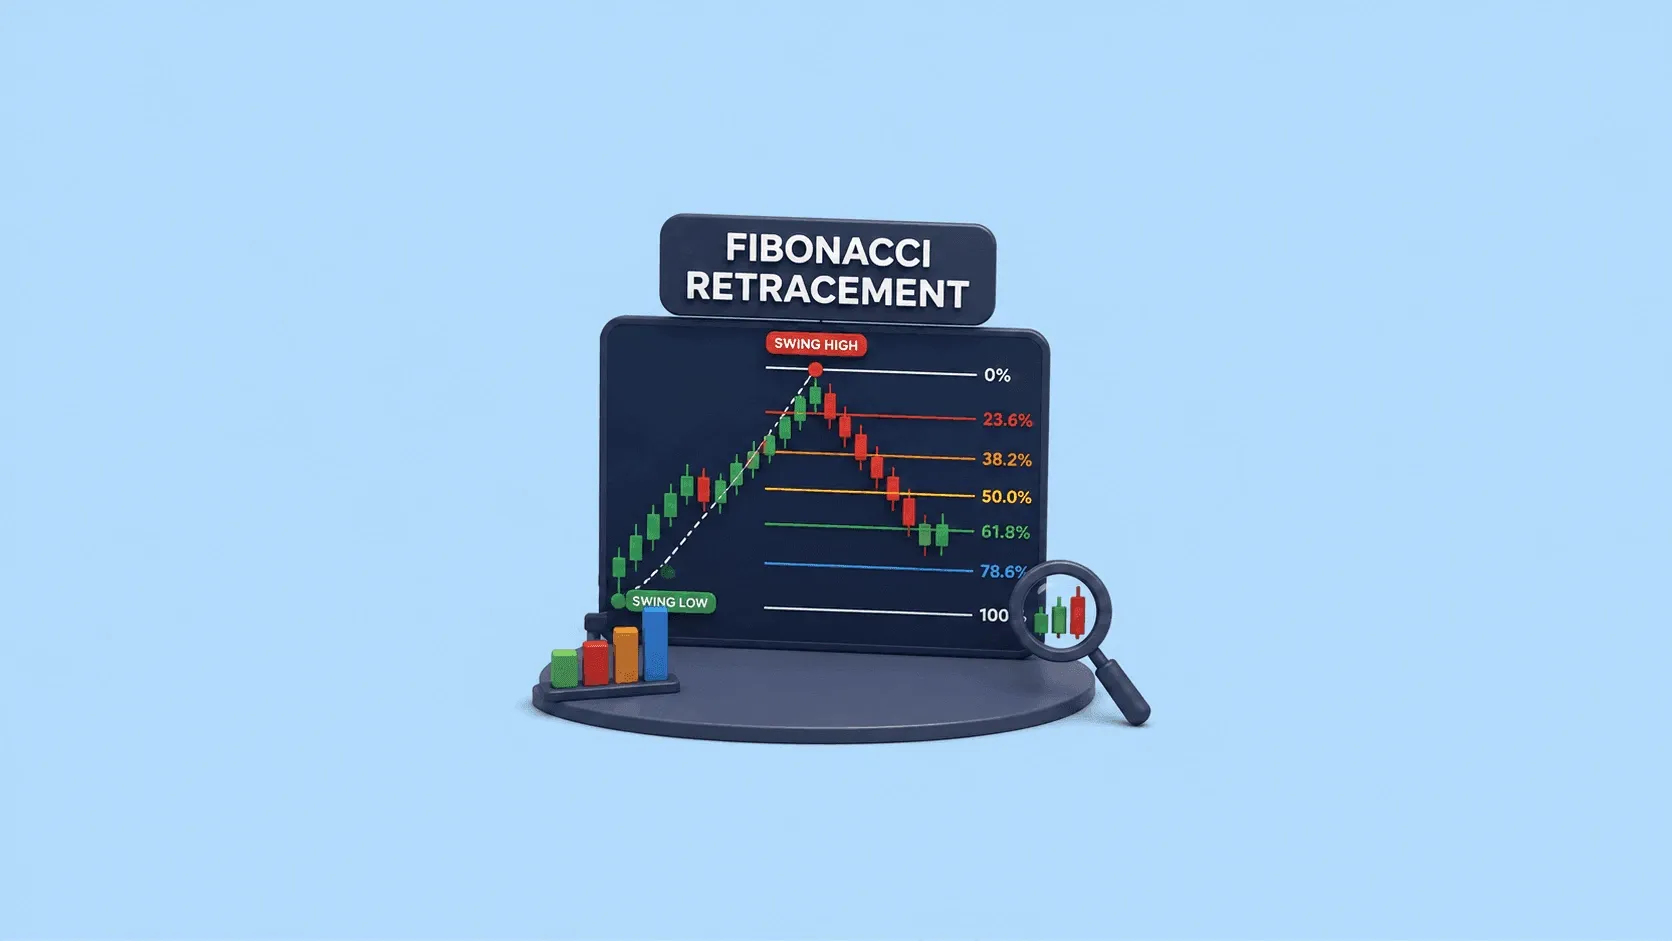
If you are a trader, you may have used technical analysis to analyse price movements and identify potential trading opportunities. While reading about technical analysis, you might have heard of the term “Fibonacci retracement”. But what exactly is it and how is it used? In this blog, we will learn about Fibonacci retracement and understand what the tool does, how it is calculated and how you can use it on a chart. What is Fibonacci Retracement (Fib)? Fibonacci Retracement is a technical ana
23 July 2026

If you’re an investor, you have likely noticed that the market selmdo moves` in a straight line. It rises, falls, consolidates, and then rises again. This repeating pattern isn’t random; it follows recurring patterns, although their duration and intensity vary from one cycle to another. This is known as the market cycle. Understanding this pattern may not always guarantee a profit, but it helps investors and traders to understand the market, rather than reacting emotionally to every news headli
23 July 2026
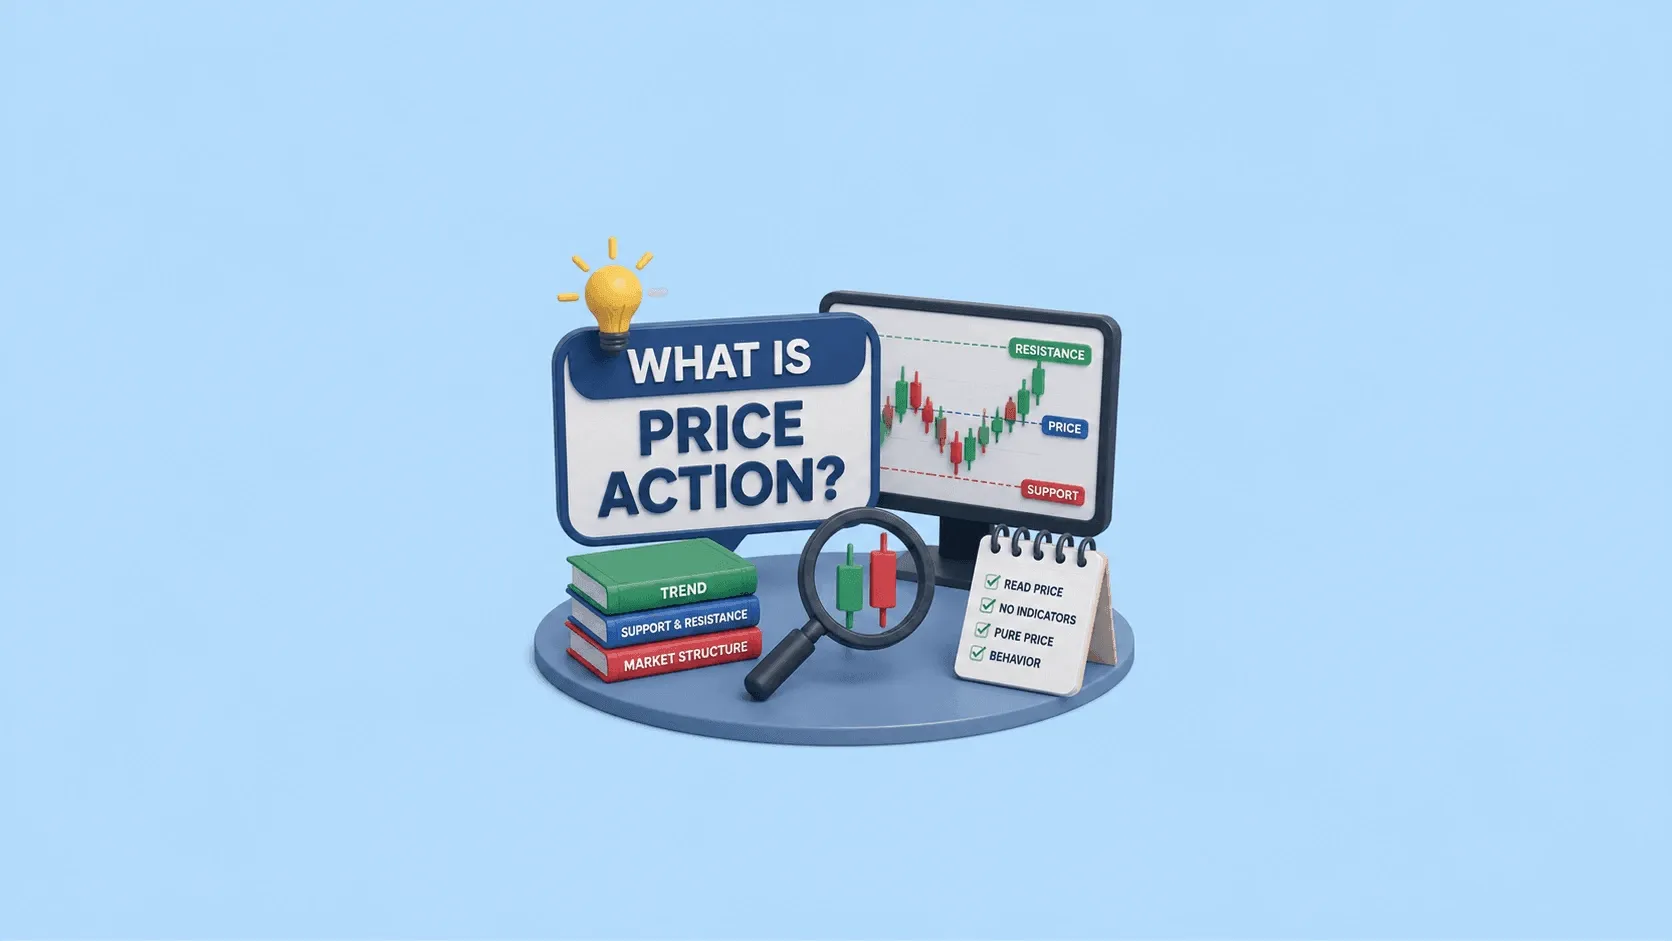
Understanding what price action is among the first steps towards becoming a better trader. Instead of relying on multiple indicators, price action trading focuses on analysing a stock's price movement to identify potential trading opportunities. Since price reflects the balance between buyers and sellers, many traders use it to understand market sentiment and make informed decisions. Whether you're new to trading or looking to improve your analysis, learning about price action in the stock mark
22 July 2026
Made for Traders.
Trusted by Investors.
Download FinX — trade confidently, invest
smarter, track everything.

Table of Contents
- What is the Momentum Trading Strategy?
- Momentum Trading vs Trend Following
- How Does Momentum Trading Work?
- Core Elements That Drive Momentum Trading
- Key Characteristics of Momentum Traders
- Benefits vs. Risks of Momentum Trading
- Example of Momentum Trading
- Popular Momentum Trading Strategies
- Best Practices for Momentum Traders
- Conclusion
- FAQs