
Positional trading, also known as position trading, is a long-term trading approach where traders hold stocks for weeks, months, or even years to ride major market trends. Instead of reacting to every daily fluctuation, positional traders focus on capturing large, sustained moves, the kind that can dramatically compound returns over time.
In this blog, we’ll break down what is positional trading, how it works, key characteristics, advantages and disadvantages, strategies, tools, risk management principles, tax implications, and who this style is best suited for.
What is Positional Trading?
Positional trading is a long-term trading strategy in which a trader holds a stock for weeks, months, or even years to capture a significant, sustained move driven by a major market trend. This approach focuses on capturing larger percentage moves (15% to 50% or more) by riding major market or sector trends. It relies on a combination of fundamental analysis (for conviction in the asset's long-term value) and technical analysis (using daily or weekly charts to identify trend strength and entry/exit points).
Positional trading lies between short-term swing trading (shorter holds) and long-term investing (longer holds).
How Does Positional Trading in India Work?
Position trading strategy works by identifying a long-term trend and holding a stock until that trend weakens or reverses. Here's how it works step by step:
1. Identify the Long-Term Trend: Traders start by analysing weekly and daily charts to check whether the stock is in an uptrend (series of higher highs and higher lows) or a downtrend (series of lower highs and lower lows). This establishes the primary direction.
2. Use Indicators to Strengthen the View: Tools like moving averages (50-day and 200-day), MACD, RSI, and volume patterns help confirm the trend. For example, if the price stays above the 200-day moving average, it generally signals long-term bullish strength.
3. Check Fundamental Strength: Positional traders prefer companies with stable earnings, strong financials, and sector momentum. Beyond individual company health, successful positional traders often align their positions with broad economic cycles (e.g., buying industrial stocks during an expansion phase or defensive stocks during a downturn).
This macroeconomic context reduces the risk of holding a stock for months, ensuring the underlying business and the economy support the price movement.
4. Find Entry Points: Common entries include -
- A breakout from resistance
- A pullback to support
- A moving average crossover (e.g., Golden Cross)
For example, a Golden Cross (when the 50-day Moving Average crosses above the 200-day Moving Average) is a strong long-term entry signal.
5. Set Stop-Loss & Position Size: Stop-losses are placed below key support levels or based on ATR (Average True Range) to handle volatility. Position sizes are calculated so that only a small percentage (e.g., 1% to 2%) of total capital is at risk.
6. Hold Through Minor Volatility: Once in the trade, positional traders ignore short-term fluctuations. They rely on the larger trend and weekly chart structure to stay disciplined, only reacting if the primary trend breaks.
7. Exit When the Trend Weakens: Exits typically happen when:
- A major support level breaks
- Signals like MACD or moving averages flip
- Volume suggests exhaustion
- A reversal pattern forms
Key Characteristics of Positional Trading
Positional trading has a few defining traits that set it apart from other trading styles. Here are the key characteristics every beginner should understand:
- Long Holding Period: Positions are held for weeks, months, or even longer to capture major price trends, rather than short-term fluctuations.
- Focus on Bigger Market Trends: Traders analyse broad market direction, sector strength, and long-term chart patterns rather than intraday movements.
- Daily & Weekly Charts as Primary Tools: Trend assessments, breakouts, support zones, and moving averages are primarily studied on higher timeframes such as daily and weekly charts.
- Low Trading Frequency: Since traders hold positions for extended periods, the number of trades per month is usually low, reducing brokerage costs and emotional stress.
- Combination of Technical & Fundamental Analysis: Traders often choose fundamentally strong stocks and validate them with technical signals such as moving averages, breakouts, or trend formations.
- Tolerance for Short-Term Volatility: Minor pullbacks and daily fluctuations are ignored; the focus remains on the bigger picture.
- Moderate Risk Exposure: Overnight news and gaps can impact positions, so stop-losses and proper sizing are essential. But risk is generally lower compared to high-frequency styles.
- Suitable for Part-Time Traders: Positional trading doesn’t require constant monitoring, making it ideal for working professionals or beginners with limited screen time.
Advantages of Positional Trading
Here are some of the advantages of the positional trading strategy:
1. Captures Big Market Moves: Since positions are held for weeks or months, traders can benefit from large trend-driven price movements rather than small daily swings.
2. Less Time-Intensive: You don’t need to watch the market all day. A weekly or even bi-weekly check is often enough, making it ideal for working professionals.
3. Lower Stress & Emotional Pressure: Fewer trades mean fewer decisions, reducing emotional fatigue, overtrading, and impulsive mistakes.
4. Lower Transaction Costs: Because trading frequency is low, brokerage fees, taxes, and slippage remain minimal.
5. Better Trend Reliability: Higher timeframes (daily/weekly) provide more reliable trend signals compared to short-term charts, improving overall accuracy.
6. Flexibility to Use Both Fundamental & Technical Analysis: Positional traders can combine strong company fundamentals with long-term chart patterns for higher conviction entries.
Disadvantages of Positional Trading
While positional trading offers strong long-term benefits, it also comes with a few challenges that traders should understand before committing to this style:
1. Capital Is Locked for Long Periods: Since trades run for weeks or months, your capital remains tied up, limiting your ability to take advantage of short-term opportunities elsewhere.
2. Exposure to Overnight & Weekend Risks: Long-term positions are vulnerable to gaps caused by global events, announcements, or unexpected news that can occur outside market hours.
3. Requires Patience & Discipline: Holding through minor corrections or sideways phases can be challenging for beginners who expect quick results.
4. Slower Feedback Loop: Because trades last longer, you get fewer data points to refine your strategy. Learning and improving take more time.
5. Potential to Miss Early Exit Signals: If not reviewed periodically, traders might hold on to weakening trends and give back profits.
6. Higher Stop-Loss Levels: Since market swings are wider on long-term charts, stop-loss distances tend to be larger, requiring proper position sizing to manage risk.
7. Emotional Difficulty During Drawdowns: Watching a position dip temporarily before continuing the trend can create emotional stress for new traders.
Popular Positional Trading Strategies
Positional traders depend on proven strategies to spot long-term trends and stay aligned with the broader market direction. Below are some of the most effective and widely used methods:
1. Trend-Following Strategy:
This is the foundation of positional trading, where traders enter only when a strong uptrend or downtrend is clearly visible.
- Uses tools like Moving Averages, MACD, and trendlines
- Example: Buying when the stock consistently trades above the 200-day Moving Average, which acts as a long-term dynamic support
2. Breakout Trading Strategy:
Traders enter when the price breaks above resistance or below support with strong volume.
- Great for catching early phases of big moves
- Works well with stocks that consolidate for long periods before a sharp breakout
3. Moving Average Crossover Strategy:
This method uses two different Moving Averages to identify long-term trend shifts.
- Example: The Golden Cross (50-day MA crossing above the 200-day MA) indicates a potential long-term uptrend
- Simple, reliable, and popular among beginners and experienced traders
4. Fundamental + Technical Hybrid Strategy:
A high-conviction approach combining financial fundamentals with technical charts.
- Look for companies with strong earnings growth, sound balance sheets, and sector tailwinds
- Entries are confirmed using weekly chart signals like breakouts or trend reversals
5. Support–Resistance Reversal Strategy:
Ideal for stocks trading in broad, predictable ranges.
- Buy near strong support zones and sell near resistance
- Requires patience, as ideal levels may take weeks or months to form
6. Pullback Trading Strategy:
Traders join long-term trends during short-term corrections.
- Example: Buying during a pullback to the 50-day or 100-day Moving Average
- Helps achieve better risk–reward compared to entering after a sharp rally
Tools & Indicators for Positional Trading
Positional traders rely on a mix of charting tools, technical indicators, and fundamental data to identify strong long-term opportunities. Here are the most useful tools and indicators to support this style:
1. Moving Averages (50-day, 100-day, 200-day):
These help identify the overall trend direction and key support/resistance zones.
- 200-day MA: Long-term trend indicator
- 50-day & 100-day MA: Help time entries during pullbacks
2. Relative Strength Index (RSI):
RSI helps determine whether a stock is overbought or oversold.
- RSI below 40–45: Often used to spot accumulation zones in an uptrend
- RSI above 60–70: Used to confirm bullish strength
3. MACD (Moving Average Convergence Divergence):
A popular trend and momentum indicator.
- The MACD line crossing above the signal line indicates bullish momentum
- Useful for confirming long-term trend reversals
4. Volume Analysis:
Volume validates the strength behind a price move.
- Breakouts with high volume indicate higher conviction
- Helps avoid false breakouts, which are common in the Indian market
5. Trendlines & Chart Patterns:
Simple but powerful tools for visual trend identification.
- Patterns like triangles, flags, rectangles, and channels help spot continuation or reversal setups
- Trendlines confirm breakouts or breakdowns
6. Support and Resistance Levels:
Crucial for planning entries, exits, and stop-loss placement.
- Weekly and monthly levels carry higher importance
- Helps traders avoid buying at resistance or selling at support
7. Fundamental Analysis Tools:
Positional traders often use fundamentals to build conviction.
- Quarterly results
- EPS growth
- Debt-to-equity ratio
- Sector performance
- Promoter shareholding
8. Stock Screeners:
Useful for filtering stocks based on trend, fundamentals, and volume. Popular platforms include:
- TradingView
- Screener. in
- Moneycontrol
- Trendlyne
- Chartink (for technical screens)
How to Trade Using Positional Trading Strategies? (Step-by-Step)
Here is a simple step-by-step roadmap you can use to build and execute positional trades confidently:
Step 1: Identify the Broader Market Trend
Before picking any stock, check whether the market (Nifty 50, Nifty Midcap, or sector index) is in an uptrend, a downtrend, or a consolidation.
- Use weekly and daily charts
- Check if the index is above key moving averages (like the 200-day MA)
This ensures you trade with the market, not against it.
Step 2: Select Stocks Showing Strength:
Choose fundamentally strong companies or technically strong charts. Positional traders generally prefer highly liquid large-cap and mid-cap stocks to manage large position sizes and exit trades smoothly without impacting market prices. You can shortlist stocks based on:
- Higher highs & higher lows
- Breakouts on weekly charts
- Strong sector trends (e.g., PSU, FMCG, IT)
- High-volume moves
Indian screeners like Chartink, Screener.in, or Trendlyne help speed up this process.
Step 3: Confirm the Setup With Indicators:
Once you shortlist a stock, validate it using popular positional indicators:
- 200-day MA for long-term trend
- RSI to confirm momentum
- MACD for trend reversal signals
- Volume for breakout confirmation
This step helps remove low-quality setups.
Step 4: Plan Your Entry Point:
Your entry depends on the strategy:
- Trend-following: Enter when price stays above key MAs
- Breakouts: Enter when the price breaks resistance with volume
- Pullbacks: Enter near 50-day/100-day MA retracements
- Support–resistance: Enter near strong support
Avoid chasing large green candles, wait for a stable candle, or retest when possible.
Step 5: Set Your Stop-Loss Based on Structure:
Positional traders use wider, more meaningful stop-losses:
- Below major support
- Below swing lows on weekly/daily charts
- Based on ATR multiples (e.g., 2× ATR)
This helps you stay in the trend without being shaken out by minor volatility.
Step 6: Determine Your Position Size:
Calculate how much quantity to buy based on your risk per trade.
Buy Quantity = Capital Risk per Trade / Stop-Loss Distance (Entry Price - Stop-Loss Price)
For example: If you risk ₹5,000 per trade and your stop-loss is ₹50 away →
Buy quantity = 5,000 ÷ 50 = 100 shares
Position sizing is more important than the entry.
Step 7: Set Target Levels or a Trailing Exit:
Positional traders typically use:
- Trend exits: Exit only when the trend breaks (price closes below 200-day MA)
- Target exits: Based on resistance levels or Fibonacci projections
- Trailing stops: Moving stop-loss higher as the trend continues
Exiting correctly is what maximises long-term returns.
Step 8: Monitor the Trade Periodically:
You don’t need daily monitoring, just review positions once every few days or weekly if using weekly charts.
Check for:
- Trend strength
- Volume behaviour
- Break of structure
This keeps emotions out of the process.
Step 9: Review & Record Your Trades:
Maintain a simple trading journal:
- Entry reason
- Exit reason
- Risk-to-reward ratio
- What went right/wrong
This is the fastest way to improve as a positional trader.
Risk Management in Positional Trading
Effective risk management is essential for positional traders because positions remain open for weeks or months, exposing them to larger price swings.
1. Use Structure-Based Stop-Loss Levels:
Stop-loss placement should be based on major support levels, swing lows, or long-term moving averages such as the 100-day or 200-day MA. This prevents getting shaken out by normal market fluctuations.
2. Apply ATR for Volatility-Based Stop-Losses:
Using the Average True Range (ATR) helps you set stop losses that match the stock’s volatility. Many positional traders place stop-losses at about 1.5 to 2 times the ATR below the entry to allow enough breathing room.
3. Maintain a Favourable Risk-to-Reward Ratio:
Every trade should offer a strong reward compared to the risk. A minimum ratio of 1:3 is recommended, meaning you risk ₹1 to aim for ₹3 or more. This ensures long-term profitability even with occasional losses.
4. Size Positions Based on Risk, Not Capital:
Position size should depend on how much you are willing to lose if the stop-loss is hit. Traders calculate quantity by dividing their maximum risk per trade by the stop-loss distance. This approach prevents oversized trades.
5. Avoid Sector Overexposure:
Since Indian markets move in sector trends, avoid placing too many trades in the same sector. Distributing exposure across banking, FMCG, IT, metals, autos, and other segments helps reduce concentration risk.
6. Use Trailing Stop-Losses to Protect Profits:
As the trade moves in your favour, shift your stop-loss to breakeven and gradually trail it as the trend continues. This helps lock in gains without exiting too early.
7. Reduce Exposure Before Major Events:
Positional traders face overnight and weekend risks. Avoid fresh entries before major events like RBI policy announcements, Union Budget, global interest rate decisions, or major corporate earnings. A common method is using a Moving Average (MA) as a dynamic trailing stop. For instance, many positional traders use the 50-day MA or 100-day MA and exit the position only when the price closes below that specific moving average.
Difference Between Positional Trading & Other Trading Styles
Here’s a quick comparison between positional trading, swing trading, and intraday trading to help beginners understand the contrasts clearly:
| Feature | Positional Trading | Swing Trading | Intraday Trading |
|---|---|---|---|
| Holding Duration | Weeks to Months | Days to Weeks | Minutes to Hours |
| Goal | Capture big trends | Capture shorter swings | Profit from daily moves |
| Charts Used | Weekly & Daily | Daily & Hourly | Minute-by-minute |
| Risk Level | Medium to low (with proper stop-loss) | Medium-High | High due to rapid price movements |
| Time Required | Low; periodic monitoring | Medium | High; requires active screen time |
| Impact of News | Medium; affected by big events | Medium-High | Very high; intraday moves react instantly |
| Suitable For | Working Professionals | Active Traders | Full-time Traders |
Who Should Choose Positional Trading?
Positional trading is a great fit for traders and investors who want to benefit from long-term market trends without the stress of constant monitoring. You should consider this approach if:
1. You Prefer Long-Term Trend Following:
If you’re comfortable holding stocks for weeks or months and want to ride big price movements rather than chase daily fluctuations, positional trading suits you well.
2. You Don’t Have Time for Daily Monitoring:
Working professionals, business owners, students, or anyone with limited screen time will appreciate the low-maintenance nature of positional trades.
3. You Have Patience and Emotional Discipline:
Positional trading requires staying calm during short-term volatility. If you can stay focused on the bigger picture, this style is ideal.
4. You Want to Combine Investing With Trading:
This style blends the best of both worlds, fundamental strength and technical timing. If you like analysing companies but also want strategic entries and exits, this method is perfect.
5. You Prefer Lower Stress Compared to Intraday/Swing Trading:
Because trades are planned on weekly or daily charts, decisions are slower, clearer, and less pressured. It’s suitable for traders who want a less hectic approach.
6. You Want to Benefit From Long-Term Tax Advantages:
In India, positions held for more than 12 months qualify for Long-Term Capital Gains (LTCG) tax, which is lower than short-term capital gain taxes, a big advantage for positional traders.
7. You Are Comfortable With Wider Stop-Loss Levels:
If you can manage capital properly and accept broader stop-loss distances required for long-term trends, positional trading becomes easier and safer.
Tax Considerations for Positional Traders in India
Taxation plays a major role in determining the net returns of positional traders. Since trades may be held for several months or more than a year, understanding India’s capital gains tax rules is essential.
1. Short-Term Capital Gains (STCG) Tax:
If you sell listed equity shares within 12 months, the profit is treated as a short-term capital gain. STCG on listed equities continues to be taxed at 15%, plus surcharge and cess.
2. Long-Term Capital Gains (LTCG) Tax:
If you hold listed equity shares for more than 12 months, the profit qualifies as a long-term capital gain. As per the updated rules:
- LTCG tax rate is 12.5% for all capital assets.
- For listed equity shares, equity-oriented mutual funds, and units of business trusts, LTCG exceeding ₹1.25 lakh in a financial year is taxed at a flat 12.5%.
This revised LTCG structure clarifies the treatment of stocks held for more than one year by positional traders.
3. Dividend Taxation:
Dividends received from Indian companies are added to your total taxable income and taxed based on your individual income tax slab.
Conclusion
Positional trading is a powerful approach for investors who prefer steady, long-term growth over frequent trading. By focusing on broader market trends, using reliable strategies, and applying disciplined risk management, traders can capture meaningful price movements with relatively lower stress. While it requires patience and a strong understanding of both fundamentals and technicals, positional trading offers a balanced way to build wealth over time. With the right strategy, tools, and tax awareness, it can be an excellent fit for anyone aiming to grow their portfolio with confidence and consistency.
FAQs
1. What is an open position in trading?
An open position is an active trade you currently hold. It stays open until you exit by buying or selling.
2. What is position size in trading?
Position size is the number of shares or contracts you buy or sell, calculated based on the risk you’re willing to take and the distance between your entry and stop-loss.
3. What is the best time frame for positional trading?
The best time frames for positional trading are daily and weekly charts. Daily charts help with entries; weekly charts confirm long-term trend direction.
4. Is positional trading better than swing trading?
Neither strategy is definitively "better"; they are simply different. The ideal choice depends on your trading goals, risk tolerance, capital, and available time.
- Choose Swing Trading if: You want quicker returns, enjoy short-term action, and can commit time to regular market monitoring.
- Choose Positional Trading if: You prefer patience, less screen time, lower transaction costs, and want to capitalise on major, long-term market trends.
5. Can beginners start with positional trading?
Yes, positional trading is often recommended for beginners because it requires less time commitment and reduces the stress of short-term volatility. Beginners should still practice risk management, start small, and avoid over-leverage even in positional setups.
Related Blog
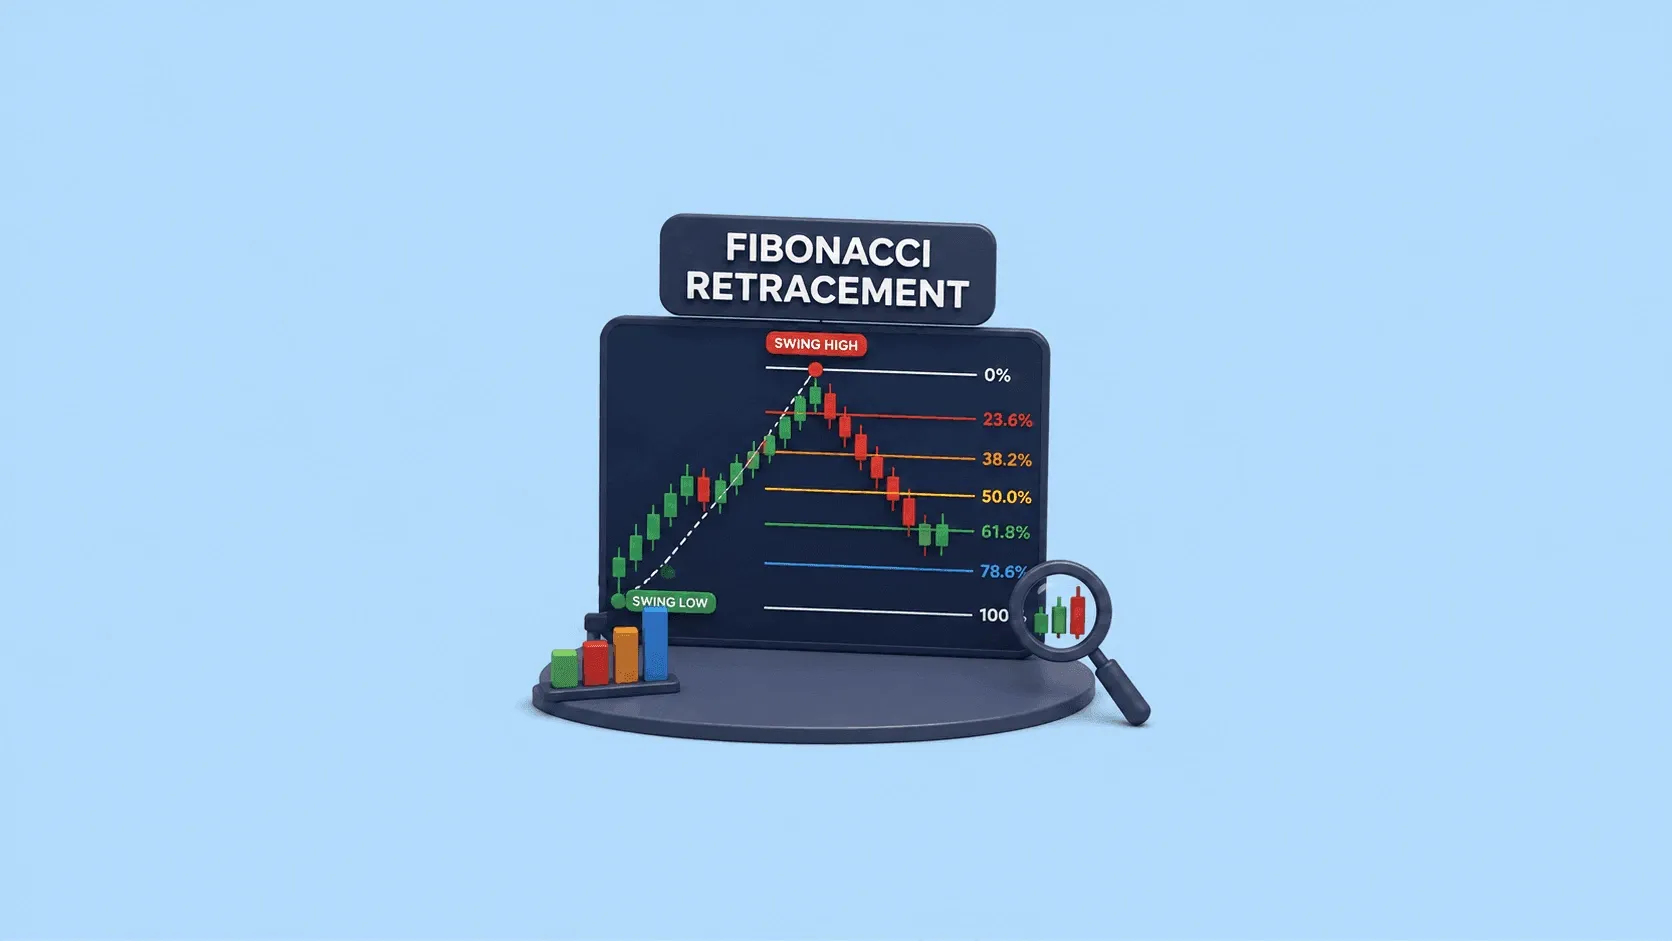
If you are a trader, you may have used technical analysis to analyse price movements and identify potential trading opportunities. While reading about technical analysis, you might have heard of the term “Fibonacci retracement”. But what exactly is it and how is it used? In this blog, we will learn about Fibonacci retracement and understand what the tool does, how it is calculated and how you can use it on a chart. What is Fibonacci Retracement (Fib)? Fibonacci Retracement is a technical ana
23 July 2026

If you’re an investor, you have likely noticed that the market selmdo moves` in a straight line. It rises, falls, consolidates, and then rises again. This repeating pattern isn’t random; it follows recurring patterns, although their duration and intensity vary from one cycle to another. This is known as the market cycle. Understanding this pattern may not always guarantee a profit, but it helps investors and traders to understand the market, rather than reacting emotionally to every news headli
23 July 2026
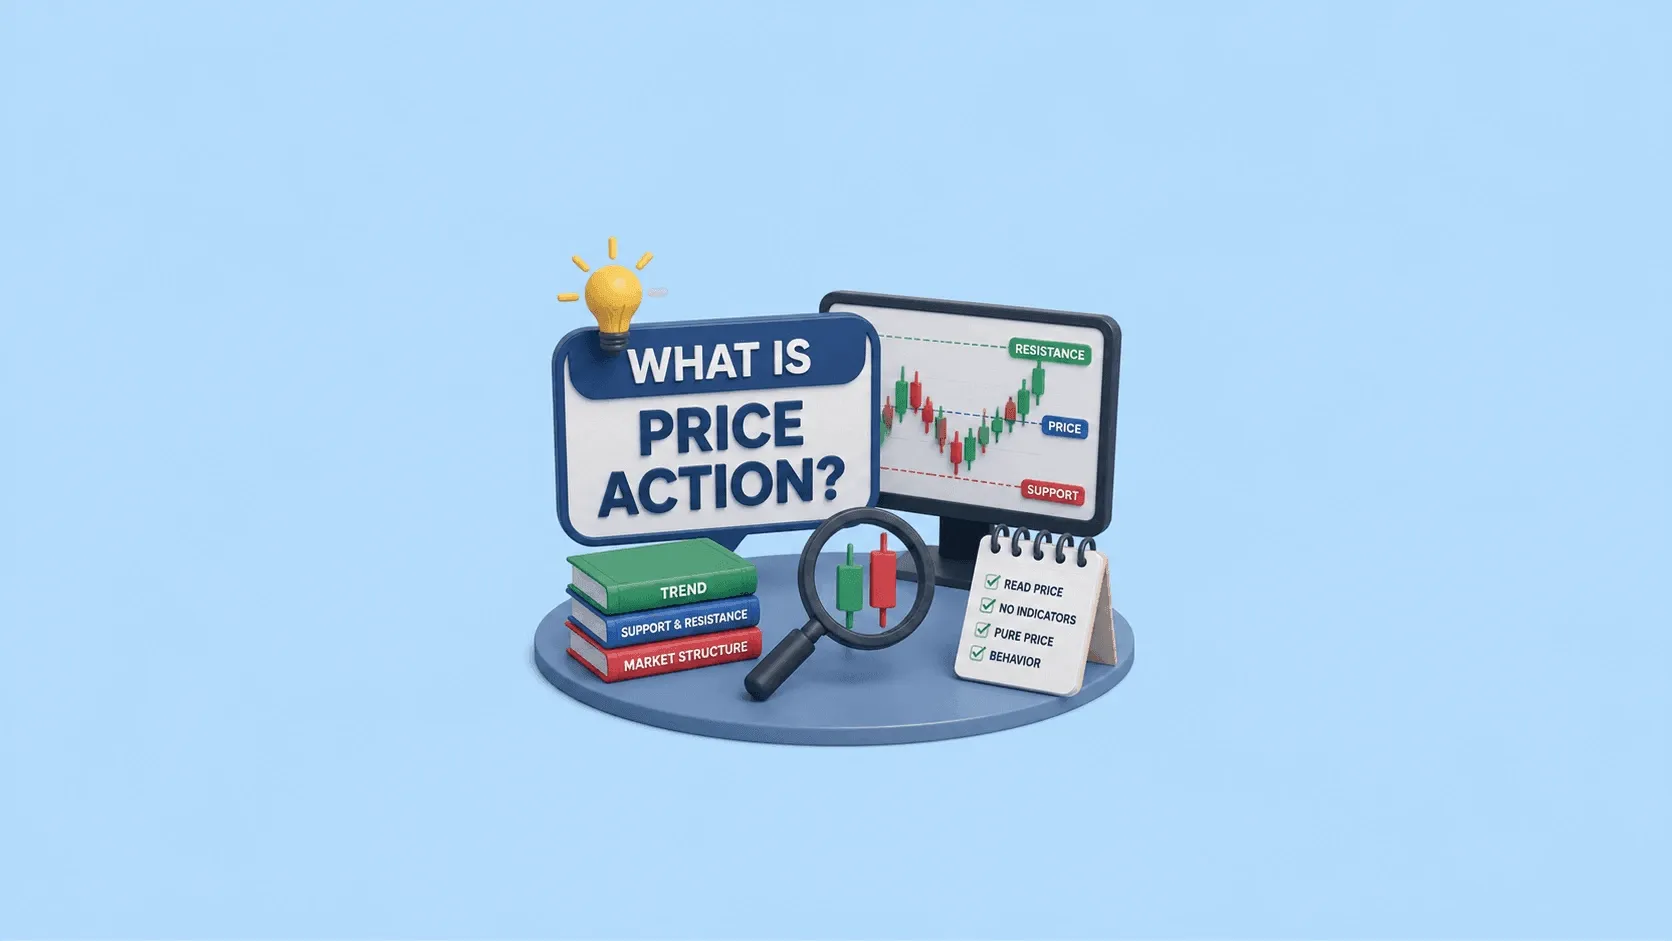
Understanding what price action is among the first steps towards becoming a better trader. Instead of relying on multiple indicators, price action trading focuses on analysing a stock's price movement to identify potential trading opportunities. Since price reflects the balance between buyers and sellers, many traders use it to understand market sentiment and make informed decisions. Whether you're new to trading or looking to improve your analysis, learning about price action in the stock mark
22 July 2026
Made for Traders.
Trusted by Investors.
Download FinX — trade confidently, invest
smarter, track everything.

Table of Contents
- What is Positional Trading?
- How Does Positional Trading in India Work?
- Key Characteristics of Positional Trading
- Advantages of Positional Trading
- Disadvantages of Positional Trading
- Popular Positional Trading Strategies
- Tools & Indicators for Positional Trading
- How to Trade Using Positional Trading Strategies? (Step-by-Step)
- Risk Management in Positional Trading
- Difference Between Positional Trading & Other Trading Styles
- Who Should Choose Positional Trading?
- Tax Considerations for Positional Traders in India
- Conclusion
- FAQs