Channel Formations in Trading
- Published Date: January 04, 2021
- Updated Date: August 08, 2025
- By Team Choice
We know of candlestick formations to give us clues regarding the direction the market is about to take. Technical analysis is a broad subject, and while candlesticks are an important element, it’s not the only one, channel formations is another such tool.
What are channel formations?
Channel formations or patterns are essentially price action channels, which shows where the trend is headed. The prices bounce off parallel lines of resistance and support forming ‘channels’, that indicate a continuous pattern of bullish or bearish trends.
“Upper trend line indicates resistance and connects the series of highs”
“Lower trend line indicates support and connects the series of lows”
How do we draw channels?
The following points will help,
· Support and Resistance must be parallel to each other
· Do not force the price into the channels and vice-versa
· Angles of channels are important; trend lines cannot be at varied angles in where they won’t be parallel. This will lead to unsuccessful trades.
Types of Channels
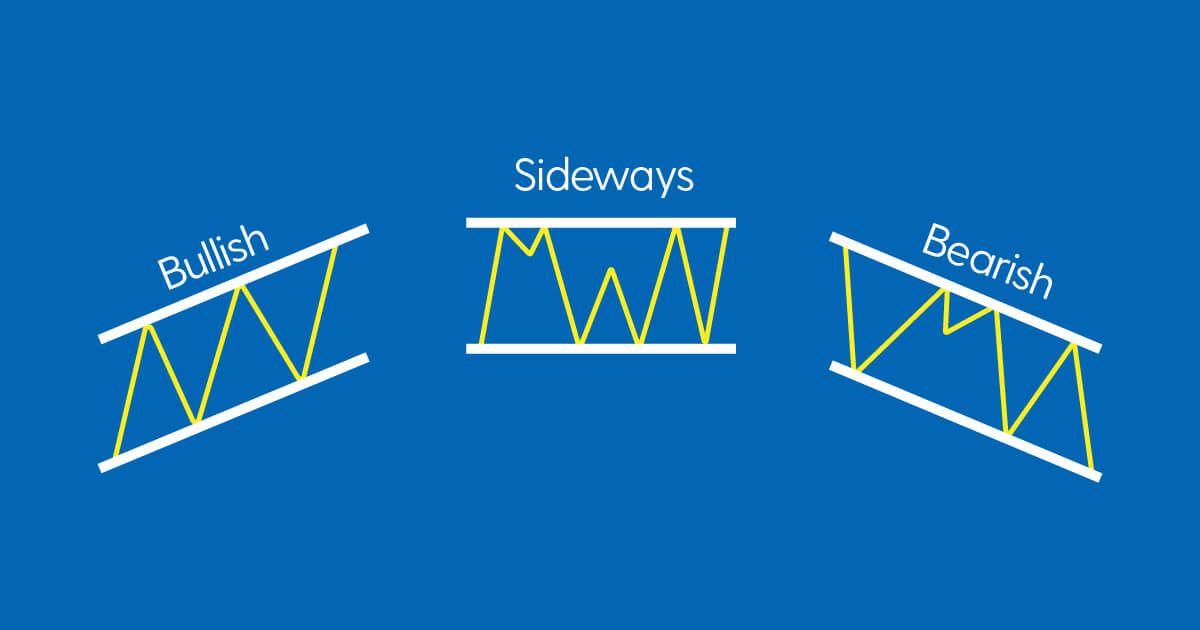
Bullish Channel
This channel is marked by prices making higher highs and lower lows. The price is continuously on the rise and stays within the confines of parallel resistance and support.
· Trend is bullish
· Break above resistance indicates a continuation of the bullish trend
· Prices falling short of resistance signals slowing down of current trend and a likely reversal
· Break below support signals change in trend
Bearish Channel
These channels are characterized by prices making lower lows followed by higher highs. The price keeps on declining and stays within the channel boundaries.
· Trend is bearish
· Prices breaking below resistance channel shows a continuation of the trend
· Prices not reaching support signals change in trend
· Break above resistance indicates a change in trend
Rectangle Channel
This channel is formed between horizontal lines indicating significant support and resistance.
- Price moves horizontally between Support and Resistance levels
- No trend here, as price simply moves between support and resistance
- When price breaks out of the rectangle channel; it ends with a breakout, likely into a new trend
Recommended for you

Share Market Prediction For Tomorrow

Copper Price Forecast for Next Week

Market Prediction Today (16th February 2026)