
In the world of technical analysis, candlestick patterns serve as visual cues that reflect market sentiment. Among these, the three inside down candlestick pattern is a notable formation that traders use to identify potential reversals from bullish to bearish momentum.
This article explores the structure, significance, trading implications, and limitations of the 3 inside down candle pattern, offering insights grounded in market psychology and practical application.
Three Inside Down Candlestick Pattern - Meaning
The three inside down candlestick pattern is a distinct three-candle formation indicating a likely shift from an uptrend to a downtrend. Its formation starts with a prominent bullish candle, followed by a smaller candle (which can be either bullish or bearish) that settles at a lower closing price than the first. The third candle solidifies this reversal, closing beneath the second candle's close and indicating a strengthening bearish momentum.
This candlestick structure is a commonly used tool in technical analysis, helping traders anticipate possible bearish reversals. Part of the broader group of inside bar patterns, the three inside down pattern captures a subtle but significant transition in market sentiment, hinting that buyers may be losing control while sellers start to gain traction.
3 Inside Down Candlestick Pattern Composition: How the Formation Develops?
The three inside down candlestick formation unfolds over three distinct sessions, each contributing uniquely to the pattern's overall meaning:
1. First Candle – Strong Bullish Momentum:
The formation starts with a large, upward-trending candle, reflecting significant purchasing activity and reinforcing the prevailing bullish sentiment.
2. Second Candle – Consolidation Within the Range:
The second candle is significantly smaller and completely contained within the first candle's high and low. It can be either a bullish or bearish candle, but its limited size and position signal market hesitation and a potential weakening of the upward trend. Often referred to as the “inside candle,” it marks a possible turning point where the balance of power begins to shift.
3. Third Candle – Bearish Confirmation:
The pattern concludes with a distinct bearish candle whose closing price falls beneath the initial candle's lowest point. This downward close confirms that sellers have gained control, marking a potential reversal in trend. Its decisive movement reinforces the pattern’s bearish nature, solidifying it as a valid three inside down reversal signal.
Each of these candles plays a specific role in transitioning market sentiment from optimism to caution, and finally to bearish conviction.
Three Inside Down Candlestick: Identifying the Pattern on Price Charts
Spotting the three inside down pattern requires close observation of three consecutive candles and understanding how they relate to one another:
1. The First Candle: Begin by identifying a large bullish candle, which reflects strong upward momentum and continued interest from buyers. This candle typically appears during an ongoing uptrend, laying the groundwork for the pattern.
2. The Second Candle: Following the initial candle, identify a smaller candle, regardless of whether it's bullish or bearish, that falls entirely within the preceding candle's high and low range. This "inside" candle reflects market indecision or weakening buying enthusiasm, signalling that momentum may be slowing.
3. The Third Candle: The last candle in the formation needs to be a bearish one, and its closing price must be lower than the first candle's low. This closing action confirms that sellers have overtaken buyers and that the trend could be reversing to the downside.
When all three candles align in this sequence, the three inside down candlestick pattern suggests a possible shift in trend direction. It serves as an early warning for traders that the preceding bullish momentum may be fading, offering a potential opportunity to adjust positions or manage risk accordingly.
Market Psychology Behind the Three Inside Down Pattern
The three inside down candlestick pattern offers a window into changing market sentiment, specifically, a transition from bullish enthusiasm to growing bearish conviction. Understanding the psychology behind each candle helps traders interpret the potential shift in momentum more clearly.
Candle 1: Confidence Continues
The formation initiates with a strong upward-trending candle, signalling the continued control of buyers. This candle often follows a sustained uptrend, reflecting continued optimism among market participants. The mood at this stage is generally positive, with traders expecting higher prices.
Candle 2: Indecision and Emerging Resistance
A bearish candle then appears, fully enveloped by the high and low of the preceding candle. This marks a subtle but important shift. Buyers fail to push prices higher, and sellers begin to resist further gains. This candle represents indecision or early caution; buyers may be taking profits, while sellers are starting to test their influence.
Candle 3: Shift Toward Bearish Contro
The third candle is also bearish, but its importance lies in its closing price, which falls below the second candle's close, indicating that sellers are increasing their dominance. At this point, the market psychology tilts: previously bullish traders may start to reassess, while bearish traders see confirmation of a potential trend reversal.
When Does the Three Inside Down Pattern Typically Appear?
The three inside down candlestick pattern usually emerges near the peak of an upward trend, signalling a potential shift in direction. It's most meaningful when it follows a period of consistent bullish price movement, particularly when the asset is approaching a known resistance level or appears to be overextended.
This pattern often shows up in environments with moderate to high price fluctuations, as the volatility creates the conditions necessary for the middle "inside" candle to develop. That said, even in relatively stable markets, the pattern can offer useful insights, especially when it's supported by other technical tools that suggest a weakening bullish trend.
Ultimately, understanding the broader market context is key. The pattern gains reliability when it aligns with additional signs of slowing momentum or reversal, helping traders make more informed decisions about potential entry or exit points.
Trading Strategy: How to Use the Three Inside Down Pattern Wisely
For traders looking to make the most of the three inside down candlestick, following a disciplined and thoughtful strategy is essential. Below are several commonly used methods to effectively trade this formation:
1. Trend Reversal Entry: This is the foundational approach where traders initiate a short position once the third candle closes beneath the low of the first bullish candle. The idea is to enter the trade at the earliest sign of a confirmed shift in market sentiment, aiming to capture a potential downward move early in its development.
2. Waiting for a Breakout Confirmation: To reduce the chances of entering on a false signal, some traders choose to wait for an additional bearish candle after the pattern completes. This added validation assists in confirming the durability of the downward trend, distinguishing it from a fleeting retracement.
3. Using Bearish Divergence for Validation: Incorporating technical indicators like the Relative Strength Index (RSI) can provide further support for the setup. During the pattern's development, imagine the Relative Strength Index (RSI) indicating a bearish divergence, with the asset's price reaching higher peaks while the RSI records lower peaks.
4. Managing Risk with Trailing Stops: Implementing trailing stop-loss orders allows traders to protect profits as the trade moves in their favour. This dynamic risk management approach helps secure gains while giving the trade room to develop if the bearish trend continues.
5. Applying Multi-Timeframe Analysis: Verifying the pattern on larger timeframes (such as daily or weekly charts) can improve trade confidence. While the pattern may appear on shorter intraday charts, aligning it with higher-timeframe signals adds a layer of confirmation and helps filter out noise.
The discussed strategies demonstrate the necessity of considering market conditions, validating signals, and managing risk effectively while trading based on the three inside down candlestick pattern.
Note: Relying solely on candlestick patterns without confirmation and context may lead to false signals. Always perform independent research and consider consulting a qualified financial advisor before making investment decisions.
Real-World Example: Three Inside Down in Action
Let’s walk through a hypothetical scenario to understand how the three inside down candlestick pattern can signal a trend reversal and inform a trading decision.
Scenario: Stock – XYZ Technologies Ltd.
Trend Before the Pattern: The stock has been in a strong uptrend for several weeks, climbing from ₹580 to ₹645 without major pullbacks. Momentum indicators like RSI are hovering around 75, suggesting overbought conditions.
Candlestick Formation:
- First Candle (Day 1): A long bullish candle opens at ₹630 and closes at ₹645. It affirms the prevailing bullish trajectory and significant buyer engagement.
- Second Candle (Day 2): A smaller candle forms, opening at ₹642 and closing at ₹638. Its entire range remains within the high and low of Day 1. This signals hesitation, possibly due to profit-taking or reduced buying pressure.
- Third Candle (Day 3): A clear bearish candle opens at ₹635 and closes at ₹622, below the low of the first candle. This confirms a shift in momentum, indicating growing seller dominance.
Trade Setup:
- Entry Point: A trader might choose to enter a short position right after Day 3’s close, around ₹622.
- Stop-Loss: A logical stop-loss can be placed just above the high of Day 1 (around ₹646) to manage risk.
- Profit Target: Based on recent support levels or using a risk-to-reward ratio (e.g., 1:2), a target could be set around ₹590–₹600.
Outcome:
Over the next week, XYZ Technologies sees continued selling pressure, pulling the price down to ₹595. The pattern played out as expected, offering a potential 4–5% return on the trade, depending on the entry and exit strategy.
Disclaimer: Please remember, this scenario is purely hypothetical and designed for educational use. It does not constitute investment advice or endorse trading any particular stock.
Three Inside Down Candlestick Pattern: Benefits & Limitations
| Benefits | Limitations |
|---|---|
| Signals Possible Trend Reversal: The pattern can highlight a weakening bullish trend and suggest a potential shift toward bearish momentum. | Not Always Reliable: The pattern may occasionally generate misleading signals, especially in low-volume or sideways markets. |
| Simple to Identify: Its three-candle structure is easy to recognise on charts, making it beginner-friendly for those learning candlestick analysis. | Timeframe Dependent: Its effectiveness can vary. A signal on a longer-term chart (e.g., daily or weekly) may carry more weight than on shorter timeframes. |
| Works Well with Other Indicators: Combining it with tools like RSI, MACD, or volume analysis can improve decision-making and signal strength. | Delayed Confirmation: Traders often wait for the third candle to close, which may cause entry delays or missed opportunities in fast markets. |
| Supports Defined Risk Strategy: The pattern allows for clear stop-loss levels, typically above the first candle’s high, helping manage potential downside. | Open to Interpretation: Small differences in candle formation or positioning can lead to different conclusions, making it somewhat subjective. |
Understanding the Reliability of the Three Inside Down Pattern
The three inside down candlestick pattern can serve as a useful signal in technical analysis, but like all chart patterns, its effectiveness is highly dependent on context and confirmation.
When the Pattern Is More Reliable -
The three inside down pattern tends to be more dependable under the following conditions:
- Preceded by a Clear Uptrend: This pattern is most effective when it follows a strong and well-defined bullish trend. Without prior upward momentum, its signal may be less meaningful.
- Forms Near Resistance Levels: If the pattern develops close to a known resistance zone or psychological price level, it can add strength to the bearish reversal signal.
- Volume Confirms the Shift: A spike in trading volume, particularly on the third candle, supports the idea that sellers are gaining control. Low volume may suggest weak conviction behind the move.
- Aligned With Other Indicators: Pairing this pattern with tools like the Relative Strength Index (RSI), MACD, or trendline analysis can significantly enhance its reliability. For example, if RSI is indicating overbought conditions at the same time the pattern forms, it can reinforce the bearish outlook.
Limitations to Keep in Mind
- Not a Standalone Signal: The three inside down pattern should not be used in isolation. When viewed in isolation, it might yield inaccurate signals, especially in periods of horizontal price movement or subdued trading volume.
- Timeframe Sensitivity: Its reliability varies across timeframes. Generally, patterns observed on daily or weekly charts offer more consistent outcomes than those seen on shorter intervals.
- Market Conditions Matter: In strong bullish markets or during high-volatility news events, the pattern may fail to trigger a sustained reversal.
Risk Management Essentials: Protecting Your Capital When Trading Patterns
No matter how strong a candlestick pattern may appear, trading without a structured risk management plan exposes traders to unnecessary losses. The three inside down candlestick pattern, while valuable for spotting potential bearish reversals, should always be used in conjunction with disciplined risk practices.
1. Limit Exposure Per Trade: To maintain resilience, many traders advocate risking a maximum of 1-2% of their total capital per trade. This conservative allocation means that even a series of unsuccessful trades will not drastically reduce your account balance, allowing you sufficient time to await and profit from promising market conditions.
2. Use Stop-Loss Orders Effectively: A stop-loss is critical in defining the maximum amount you're willing to lose on a trade. When applying the three inside down candlestick signal:
- Place the stop-loss order just above the peak of the first (bullish) candle, allowing sufficient room for the pattern to unfold.
- Avoid setting stops too tight, as this could result in premature exits due to normal price fluctuations.
3. Define Target Levels Before Entering: Determine your take-profit levels in advance based on nearby support zones, prior price action, or technical tools like Fibonacci retracement levels. Maintaining a risk-to-reward ratio of at least 1:2 helps ensure that your winning trades outweigh the impact of losses over time.
4. Position Sizing Matters: Ensure your position size is determined by the spread between your entry and stop-loss, proportionally to your acceptable capital risk. This ensures that you're adjusting your trade size according to market conditions and volatility.
5. Avoid Overtrading Based on One Pattern: Even if the three inside down pattern appears frequently, not every instance is tradable. Be selective and avoid forcing trades in choppy or low-volume markets. Waiting for confirmation and alignment with other indicators can improve the probability of success.
6. Review and Adjust Regularly: Effective risk management includes post-trade analysis. Examine the outcomes of all your trading activities, whether they yielded gains or losses, to uncover persistent weaknesses or effective elements in your strategy. Adjust your strategy and risk rules as your experience and the market evolve.
7. Embrace Uncertainty and Diversify: As discussed earlier, the pattern carries certain limitations as it doesn’t guarantee a specific market direction. Technical analysis is inherently speculative and best used as one part of a broader strategy. Diversify across different asset classes, sectors, and frameworks to reduce the risk of heavy losses from isolated pattern failures.
Why Risk Management Is Non-Negotiable?
Many traders focus heavily on identifying setups but neglect the most important part of long-term success: capital preservation. Patterns like the three inside down offer insight, not guarantees. A sound risk framework helps you survive the losing trades and capitalise on the profitable ones.
External Factors: How Market Conditions and Regulations Influence Pattern Reliability
While technical patterns like the three inside down provide visual cues for potential price reversals, their effectiveness doesn’t exist in a vacuum. Broader market conditions, economic events, and regulatory developments can significantly impact how these patterns play out in real trading environments.
1. Impact of Market Volatility and Trend Strength:
- Volatile Markets: During periods of high volatility, such as around major economic data releases, earnings announcements, or geopolitical events, price movements can be erratic. Even well-formed patterns may fail to produce expected outcomes.
- Strong Trends: If the overall market or a specific asset is in a strong uptrend (due to positive macroeconomic sentiment or institutional buying), bearish reversal patterns like the three inside down may have reduced reliability. Price may continue upward despite short-term bearish signals.
Tip: Always assess the strength of the prevailing trend before placing trades based on reversal patterns.
2. Macroeconomic Events and Newsflow:
The following economic indicators can introduce noise that distorts short-term technical signals:
- Interest rate decisions (e.g., RBI or Federal Reserve)
- Inflation reports (CPI, WPI)
- Employment data
- Currency fluctuations and commodity price changes
For example, a three inside down pattern forming just before a major announcement might be invalidated by market reactions to unexpected data.
3. Regulatory Environment and Compliance:
Financial markets are governed by evolving regulatory frameworks designed to ensure transparency, stability, and investor protection. In India, for instance:
- SEBI (Securities and Exchange Board of India) regulates stock trading and mandates specific disclosures and compliance rules for brokers and retail traders.
- Changes in margin requirements, short-selling rules, or circuit breakers can affect how patterns behave, especially intraday.
Traders must stay updated on:
- Policy updates from regulatory authorities
- Tax implications (like Securities Transaction Tax or Capital Gains)
- Compliance with risk disclosure norms and trading limits
- Ignoring these aspects can lead to misjudged trade execution or even penalties.
4. Liquidity and Market Participation:
- Low Liquidity Stocks: In thinly traded assets, candlestick patterns are less reliable due to erratic price movements and wider spreads.
- Retail vs. Institutional Influence: Heavily institutionalised stocks or indices may behave differently due to algorithmic trading, which can quickly invalidate manual chart patterns.
5. Rise of Algorithmic Trading and Retail Participation:
The growing influence of algorithmic trading and increased retail investor activity has reshaped how patterns like the three inside down work in real-time markets.
- Algorithmic Trading: High-frequency trading algorithms can detect and react to pattern formations faster than human traders. This often leads to rapid price moves that front-run traditional setups or create false signals, reducing the window of opportunity for discretionary traders.
- Retail Crowd Behaviour: Social media-driven sentiment and coordinated buying or selling can override technical setups entirely, especially in the short term.
Final Thoughts
The three inside down candlestick pattern is a helpful visual cue that can signal a potential reversal from bullish to bearish sentiment. Its structured formation, three candles showing declining momentum, makes it a valuable addition to a trader’s technical analysis toolkit. However, like all patterns, it should not be relied upon in isolation.
Traders should treat this pattern as a supporting signal, one that contributes to a well-rounded decision-making process rather than dictating it. Recognising when and where to apply it, combined with thoughtful analysis and a strong risk framework, can improve your ability to respond to changing market conditions effectively.
Frequently Asked Questions
Is the Three Inside Down pattern a standalone, reliable signal?
No, while it signals a potential bearish reversal, it is most effective when used with other technical indicators and volume confirmation.
Can beginners use this candlestick pattern?
Yes, the pattern is simple to understand, but beginners need to open a demat account and learn risk management first.
What timeframe works best for this pattern?
Higher timeframes (like daily or weekly charts) generally offer more reliable signals due to reduced market noise.
What distinguishes the Three Inside Down pattern from the Three Black Crows pattern?
Although both are signals for a potential bearish reversal, the Three Inside Down pattern is characterised by a combination of both upward-trending (bullish) and downward-trending (bearish) candlesticks. In contrast, the Three Black Crows pattern is composed solely of three successive bearish (downward-trending) candles.
Does the pattern work in all market conditions?
It performs best in trending markets. During sideways movement or low-volume periods, its effectiveness may decrease.
Other Candlestick patterns:
| Candlestick Pattern | Description |
|---|---|
| Spinning Top Candlestick Pattern | A pattern with small real bodies and long wicks on both ends, showing indecision between buyers and sellers in the market. |
| Hammer Candlestick Pattern | A bullish reversal pattern that appears after a downtrend, with a small body and a long lower wick indicating buying pressure. |
| Shooting Star Candlestick Pattern | A bearish reversal signal that forms after an uptrend, featuring a small body and a long upper wick showing selling pressure. |
| Marubozu Candlestick Pattern | A strong momentum candle with no shadows, indicating clear control by either buyers (bullish marubozu) or sellers (bearish marubozu). |
| Long Legged Doji Candlestick Pattern | Shows market indecision with long upper and lower shadows and little to no real body, suggesting a potential trend reversal. |
| Evening Star Candlestick Pattern | A three-candle bearish reversal formation signaling the end of an uptrend and the start of a potential downtrend. |
| Inverted Hammer Candlestick Pattern | A bullish reversal pattern seen after a decline, featuring a small body and a long upper wick that hints at buying interest returning. |
Related Blog
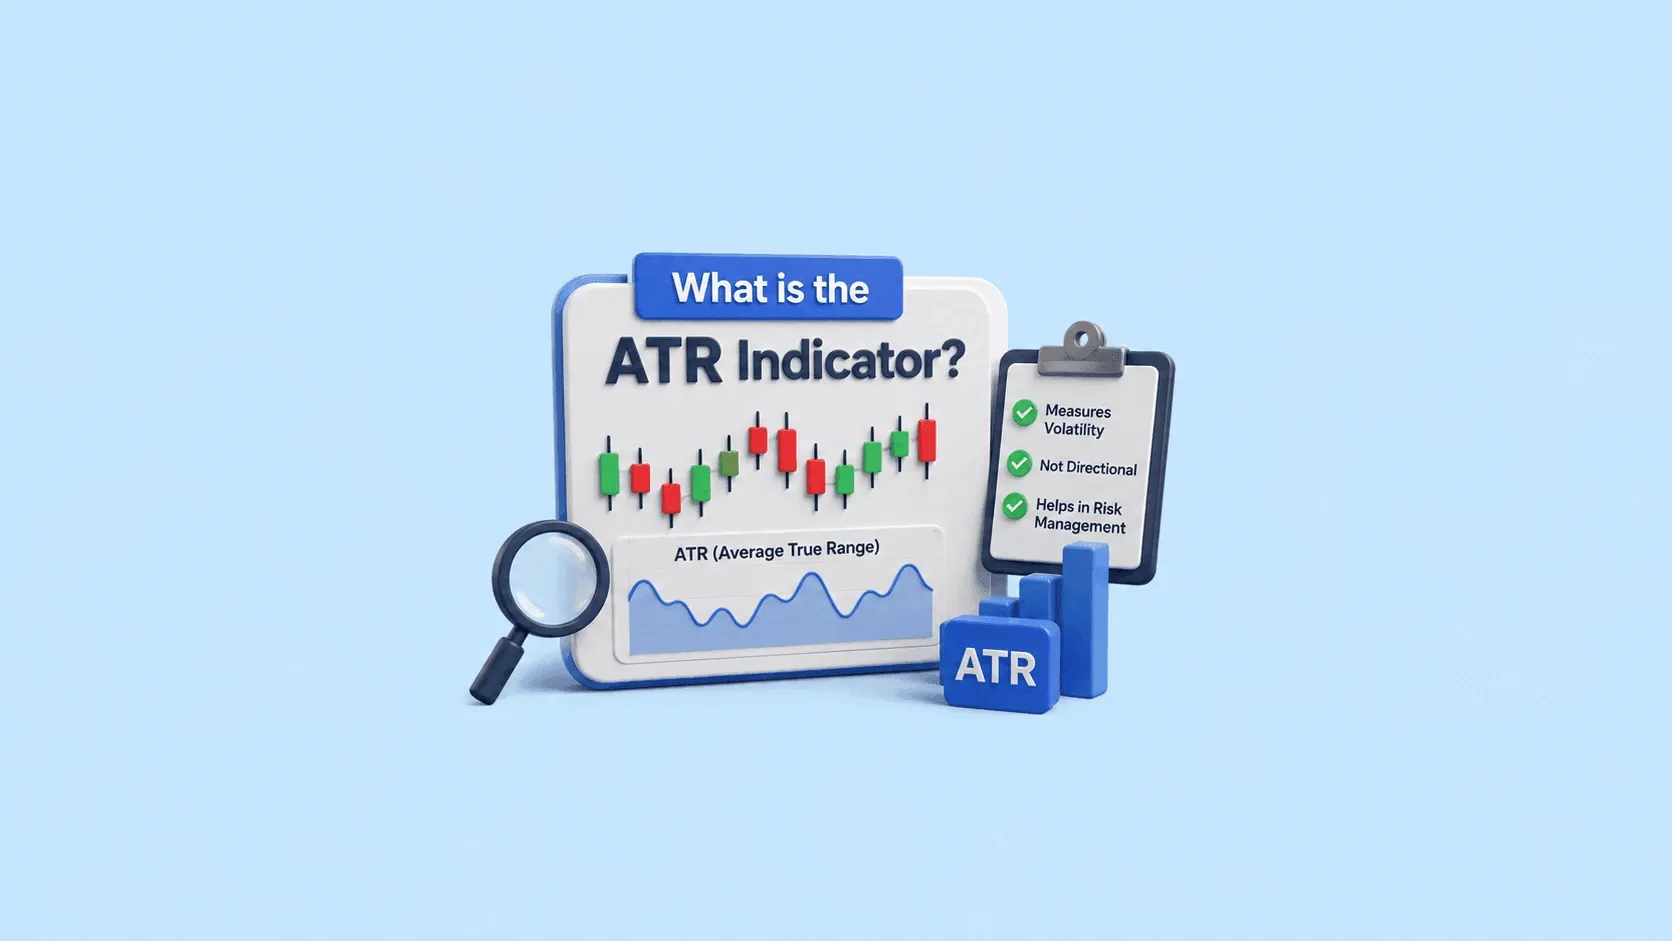
If you’re a trader whose technical analysis involves watching price movement, there is one indicator you should understand: the Average True Range. Unlike most indicators that focus on where the price is moving, ATR focuses on how much it is moving and how volatile the market can prove to be. In this guide, we will cover what Average True Range is, how it is calculated, and how it can be used to make smarter trading decisions. What is the ATR (Average True Range) Indicator? Average True Rang
16 July 2026

When you place a buy or sell order in the stock market, you may notice different order types offered by your broker. One such order type is the IOC order. Understanding what is IOC in the stock market can help you execute trades more efficiently, especially when prices change quickly. Whether you're a beginner or an active trader, knowing the IOC full form, how it works, and when to use it can help you make better trading decisions in the Stocks market. What is IOC? The IOC (Immediate or Can
16 July 2026

FII DII Data Today 15th July 2026 CATEGORY DATE BUY VALUE (₹ Crores) SELL VALUE (₹ Crores) NET VALUE (₹ Crores) DII 15-July-2026 14,235.21 13,948.99 286.22 FII 15-July-2026 12,797.18 13,416.42 -619.24 What are FII and DII in the Stock Market Foreign Institutional Investors (FIIs) invest in the Indian stock market from international markets, while Domestic Institutional Investors (DIIs) include mutual funds and institutional bodies operating from India. fii dii data helps track t
14 July 2026
Made for Traders.
Trusted by Investors.
Download FinX — trade confidently, invest
smarter, track everything.

Table of Contents
- Three Inside Down Candlestick Pattern - Meaning
- 3 Inside Down Candlestick Pattern Composition: How the Formation Develops?
- Three Inside Down Candlestick: Identifying the Pattern on Price Charts
- Market Psychology Behind the Three Inside Down Pattern
- When Does the Three Inside Down Pattern Typically Appear?
- Trading Strategy: How to Use the Three Inside Down Pattern Wisely
- Real-World Example: Three Inside Down in Action
- Three Inside Down Candlestick Pattern: Benefits & Limitations
- Understanding the Reliability of the Three Inside Down Pattern
- Limitations to Keep in Mind
- Risk Management Essentials: Protecting Your Capital When Trading Patterns
- Why Risk Management Is Non-Negotiable?
- Final Thoughts
- Frequently Asked Questions
- Other Candlestick patterns: