
Exploring and understanding candlestick patterns is crucial for anyone navigating the stock market, and among these, the long-legged doji stands out for its unique form and significant implications.
This article examines the meaning, significance, and trading strategies linked to the long legged doji candle pattern.
What is a Doji Candlestick?
In technical analysis, the doji candlestick is an important chart pattern signalling market indecision. The pattern develops when an asset's opening and closing prices are very close, creating a tiny or absent body accompanied by upper and lower shadows (wicks) of different sizes.
The doji candle's meaning lies in its ability to show that neither buyers nor sellers had full control during the trading session. This balance often signals a potential reversal, pause, or continuation depending on its location within a trend. Different types of doji candles exist, each offering distinct characteristics and market signals.
Among them, the long legged doji candlestick stands out as a significant doji candle pattern due to its strong indication of market indecision and potential trend reversal.
Long Legged Doji Candlestick - Meaning & Features
A long legged doji candlestick shows a period of significant market indecisiveness. Characterised by a very small real body and extended upper and lower wicks, it signals that prices fluctuated widely during the session, but ultimately closed near the opening level. The outcome suggests a lack of clear dominance from either buyers or sellers.
When the candle appears red, it slightly leans toward bearish sentiment, reflecting a close below the opening price. A green version, where the close is slightly above the open, may hint at a mildly bullish tone. However, in both cases, the overriding message remains one of uncertainty and hesitation in the market.
This type of doji candlestick frequently surfaces after a strong directional move, suggesting that the prevailing trend may be weakening. It can act as an early indication of a possible reversal or a period of sideways consolidation, where the market is deciding its next move.
Spotting a long legged doji candle pattern is especially valuable for traders, as it highlights a moment of balance between buying and selling pressure, often preceding significant shifts in market direction.
Features of a Long Legged Doji Candlestick
The long legged doji candlestick is distinct due to a combination of visual and contextual traits that signal market indecision. Here are its core characteristics:
1. Prominent Upper and Lower Wicks: This candlestick stands out due to its long shadows above and below a small body. These long wicks indicate significant price swings during the session, suggesting increased volatility and a power struggle between buyers and sellers.
2. Minimal Real Body: The body of the candle is very narrow, with the open and close prices nearly identical. This narrow range shows that, despite the wide price fluctuations, the market closed the session with no clear direction or control.
3. Colour Is Secondary: Whether the candle is red or green (filled or hollow) holds minimal significance. The pattern highlights its structure, particularly the small body and extended wicks, which collectively signal market participants' hesitation and lack of conviction.
4. Relevance Within the Market Trend: The impact of a long-legged doji increases when it forms after a strong uptrend or downtrend. In such contexts, it may act as a warning sign that the current trend is weakening and that a reversal or consolidation phase could be near.
Types of Doji Candlestick Patterns
In addition to the long legged doji candlestick, several other doji candle patterns offer insights into market psychology and potential price reversals. Here's a breakdown of the most widely recognised types of doji candles:
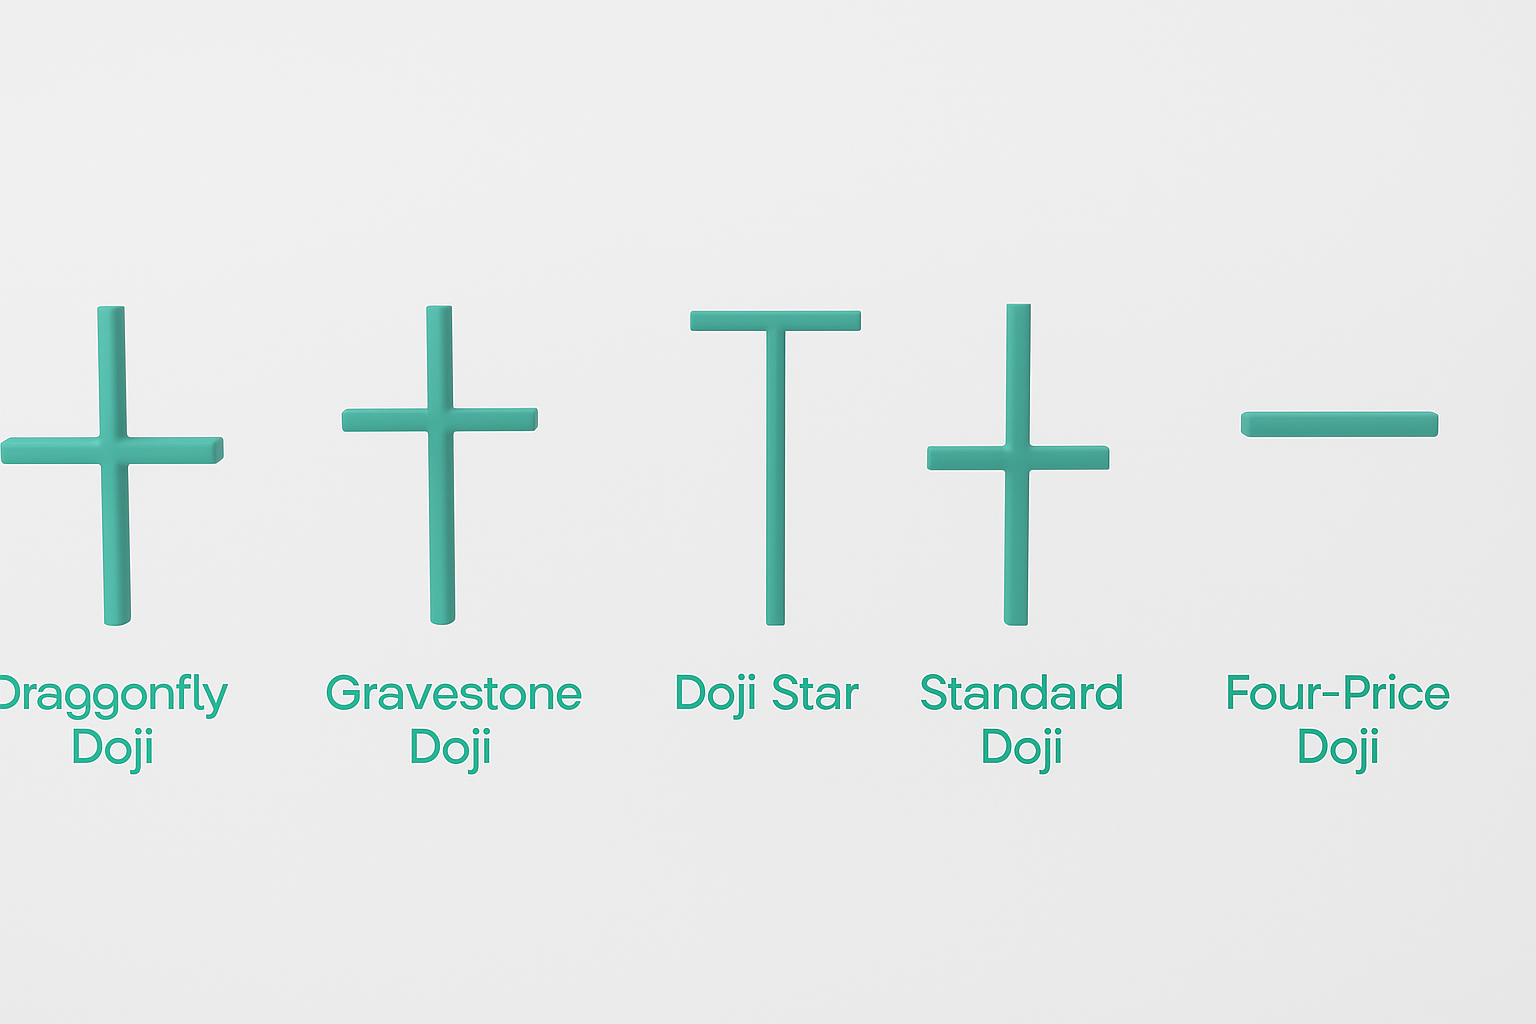
Dragonfly Doji Candelstick:
This bullish dragonfly doji candlestick forms when the opening, highest, and closing prices are roughly equal, and it features a long lower shadow.
- What it suggests: Strong buying pressure after a sell-off.
- When it matters: It's significant when it shows up at the end of a downtrend, hinting at a possible bullish reversal.
Gravestone Doji:
This bearish doji candle features a long upper wick and minimal or no lower shadow, with its opening and closing prices occurring near the session's low.
- What it signals: Rejection of higher prices by sellers.
- Where it’s used: Often found at the top of an uptrend, warning of a potential downward reversal.
Doji Star:
The doji star forms as part of a three-candle sequence, typically found in reversal patterns like the morning star or evening star.
- What it reflects: Market indecision following a strong trend.
- Trading implication: Suggests a transition in control between buyers and sellers, often leading to a reversal once confirmed.
Standard Doji:
A basic doji candle pattern where the open and close prices are nearly the same, with shadows extending on both sides.
- Indication: Complete indecision in the market.
- Utility: Can appear during trends or consolidations, signalling a potential pause or shift.
Four-Price Doji:
This is a rare and highly neutral pattern where the open, close, high, and low prices are identical. The candle appears as a flat horizontal line.
- Market behaviour: Reflects a total lack of trading activity or a perfectly balanced tug-of-war.
- Usage: Not commonly actionable, but indicates extreme indecision or illiquid conditions.
Why is the Long-Legged Doji Important in Trading?
The long legged doji candle holds significant value in technical analysis because it reveals a key psychological moment in the market, one where neither buyers nor sellers have a clear upper hand. This candlestick is a visual representation of hesitation, and recognising it can help traders anticipate important shifts in price behaviour.
Here’s why this pattern matters:
- Signals Market Indecision: The long-legged doji forms when there's a tug-of-war between bullish and bearish forces, but neither side prevails. This standoff creates uncertainty, often foreshadowing a change in the current price direction.
- Mark's Potential Turning Points: When this doji candle appears after a strong trend, either bullish or bearish, it can act as an early indicator that the momentum is fading. Traders watch closely for confirmation in the following candles to determine if a reversal or pause is underway.
- Useful for Timing Entry and Exit Points: While the doji itself isn't a signal to enter a trade, it offers a crucial heads-up. Combined with other technical tools (like moving averages, RSI, or trendlines), it helps traders better time their decisions to enter or exit positions with more confidence.
- Adds Context to Market Structure: Beyond just spotting the pattern, understanding where it forms, at resistance, support, or within a consolidation zone, enhances its predictive power. The long legged doji candlestick becomes especially meaningful when it aligns with broader market signals.
How to Recognise a Long Legged Doji Candle on the Chart?
To correctly identify a long legged doji on a chart, focus on the following distinct features:
- Tiny Real Body: The candle's open and close prices are almost identical, resulting in a very small body. This body may appear in either red or green, but the colour holds little significance compared to its size.
- Pronounced Upper and Lower Wicks: Both shadows extend well beyond the body, often equally, showing that the price moved sharply in both directions during the session.
- Body Proportionately Smaller Than Wicks: The real body is noticeably smaller than the long shadows, highlighting that despite high volatility, the session ended near where it began, emphasising market indecision.
How the Long Legged Doji Candlestick Pattern Functions in the Market?
The doji candle's core meaning revolves around indecision, a message that the long-legged doji significantly amplifies. It reveals a struggle where both bullish and bearish forces tried to dominate, but neither prevailed. Depending on the market context, this can signal:
- Potential Trend Reversal: If the long-legged doji appears after a strong uptrend or downtrend, it may suggest that momentum is weakening and a reversal could be on the horizon.
- Possible Consolidation or Pause: Sometimes, instead of reversing, the market may enter a sideways phase. This pattern can mark the start of that consolidation, where buyers and sellers reassess their positions.
- Caution in Directional Moves: The pattern serves as a warning that the current direction may no longer be reliable. Traders usually wait for the next candle to confirm whether the market's indecision leads to a trend reversal or its continuation.
Effective Trading Strategies Using the Long Legged Doji Candlestick Pattern
The long-legged doji is an effective signal of indecision, but it’s not a standalone buy or sell trigger. To trade it effectively, you need to pair it with context, confirmation, and solid risk management. Here's how to approach it:
1. Be Patient and Wait for Confirmation: Since the long-legged doji reflects uncertainty, it’s essential to observe how the market reacts in the next session.
- Observe if the price moves beyond the high or low of the doji candle.
- If the price closes above that high, it could signal a bullish continuation or a reversal.
- A close below the low could indicate bearish pressure.
Only consider entering a trade once a clear breakout or breakdown is confirmed.
2. Use Moving Averages for Additional Insight: Overlay moving averages (like the 50-day or 200-day MA) to assess the broader trend.
- If the long-legged doji forms near or cuts through a moving average, it may signal a potential reversal or breakout.
- A confirmation candle closing decisively beyond the moving average adds strength to the signal.
3. Combine with Other Indicators: Never rely solely on the doji candle pattern. Strengthen your analysis with -
- Volume: High trading volume often lends more significance to a doji.
- RSI/Stochastic Oscillator: Check if the market is overbought or oversold.
- MACD or trendlines: Use to validate momentum and direction.
Cross-confirmation improves reliability and reduces false signals.
4. Manage Risk with a Disciplined Approach: Preserving capital is key in any strategy -
- Always set stop-loss orders, ideally just outside the doji’s high or low, depending on trade direction.
- Define your risk-to-reward ratio before entering the trade.
- Follow your predetermined plan and resist the urge to chase trades emotionally.
By combining the long legged doji candlestick with supporting tools and a strong risk framework, you can turn this signal of market indecision into a calculated opportunity.
Note: The strategies presented in this article are for educational purposes only and do not constitute financial advice. Trading and investing in financial markets involve substantial risk. We advise you to conduct a deep research while considering your risk tolerance. You could even consider consulting a SEBI-registered financial advisor before making any investment decisions.
Practical Illustration of the Long Legged Doji Candle in Market Action
Let’s walk through a practical scenario to understand how a long legged doji candlestick forms and what it might signal in real market conditions.
Scenario: Long Legged Doji After an Uptrend
Imagine the stock of ABC Corp has been rising steadily for several sessions. Every day, the price opens higher, then climbs even further to close, demonstrating strong bullish momentum.
On a particular trading day, however, something changes:
- Opening Price: ₹150
- Intra-day High: ₹170
- Intra-day Low: ₹130
- Closing Price: ₹151
Here’s what happened:
- The price moved up by ₹20 and down by ₹20 during the session.
- But it closed just ₹1 above the open, forming a very small real body.
- Long upper and lower shadows show high volatility and market indecision.
Interpreting the Pattern
The doji, in this scenario, appears after a strong upward price trend. The long wicks suggest that both buyers and sellers were active, but neither gained the upper hand. The small difference between the open and close signals hesitation.
This could mean:
- Buyers are no longer in full control.
- A trend reversal might be brewing.
- The market could also enter a consolidation phase before deciding on the next direction.
What Happens Next?
Experienced traders typically avoid making trading decisions based solely on the doji candlestick. Instead, they wait for confirmation from the following candles to validate the potential signal.
- A bearish candle appearing after the doji could confirm a reversal.
- A bullish breakout might signal continuation, but with reduced momentum.
Advantages and Disadvantages of the Long Legged Doji Candlestick Pattern
Like any technical analysis tool, the long legged doji candlestick comes with both strengths and limitations. Understanding these can help you apply the pattern more effectively in real trading scenarios.
| Advantages | Disadvantages |
|---|---|
| Works Across Multiple Timeframes: Usable for intraday, swing, or long-term trading strategies. |
May Produce False Signals: Needs confirmation from other indicators or patterns. |
| Helpful for Identifying Entry/Exit Points: Can mark potential turning points for strategic trade planning. |
Requires Experience to Interpret Accurately: Misjudging the pattern can lead to incorrect decisions. |
| Useful for Spotting Trend Reversals: Acts as an early signal of potential trend changes. |
Less Reliable in Sideways Markets: Indecisive markets can make the pattern ineffective. |
| Supports Other Technical Tools: Works well with volume, moving averages, or oscillators for stronger setups. |
Not Always Effective Across All Assets: Performance can differ based on the asset class or prevailing market conditions. |
| Reflects Market Sentiment Clearly: Highlights indecision, giving insight into buyer-seller dynamics. |
Difficult for Beginners to Use Correctly: New traders may misinterpret signals without proper training. |
Comprehensive Risk Management Framework for Traders
Proper risk management is critical, especially for retail investors in India navigating increasingly volatile markets by using candlestick patterns.
1. Position Sizing:
- Never risk more than 1-2% of total capital on a single trade.
- Use position sizing formulas based on volatility (e.g., ATR-based or fixed fractional).
2. Stop-Loss Calculation:
- Set your stop-loss just past the doji candle's high or low.
- Example: If the candle's high is ₹170 and the entry is at ₹152, consider a stop at ₹171, assuming a bearish confirmation.
3. Risk-to-Reward Ratio:
- Try to achieve a reward-to-risk ratio of at least 1:2 or 1:3.
- If risking ₹10, aim for a ₹20–₹30 profit potential.
- Avoid setups that don't meet this minimum threshold.
4. Avoid Emotional Triggers:
- Don’t chase breakouts or reversals based on a single candle.
- Stick to a predefined trading plan with rules for entry, exit, and risk control.
Understanding the Role of Regulatory Body: SEBI's Importance for Retail Traders
The Securities and Exchange Board of India (SEBI) acts as the governing body for all trading and investing in India's stock market. SEBI’s regulatory framework is designed to promote transparency, protect investors, especially retail participants, and ensure fair market practices. When applying technical analysis tools like candlestick patterns, traders must comply with SEBI regulations and operate within legally approved trading frameworks.
Key SEBI Guidelines Relevant to Retail Traders:
1. Investor Risk Disclosure Requirements:
SEBI mandates that brokers and investment advisors clearly disclose risks associated with market trading. Retail traders using candlestick-based strategies, like those involving the long-legged doji, should not view these tools as guarantees of market behaviour; rather, they should see them as probabilistic indicators that require supporting evidence and context.
2. Prohibition of Misleading Claims:
Under SEBI’s code of conduct, analysts and educators are prohibited from offering false or exaggerated claims about the effectiveness of trading tools. Therefore, it’s essential to avoid overstatements such as “guaranteed signals” or “sure-shot reversals.”
3. Guidelines on Advisory Services and Education:
SEBI distinguishes registered investment advisors (RIAs) and those who act as informal educators. While this article serves an educational purpose, retail traders are advised to consult a SEBI-registered financial advisor before making real trades based on technical patterns.
Using the Long Legged Doji Pattern in the Indian Stock Market
The long legged doji candlestick holds relevance in the Indian equity markets, especially in volatile conditions or near critical support or resistance levels on actively traded indices, such as the NIFTY 50, or stocks with high liquidity. However, the pattern’s reliability is context-dependent.
Here’s how the pattern plays out under current and typical Indian market dynamics:
Increased Volatility Due to Global and Domestic Factors:
Recent years have seen increased market sensitivity to macroeconomic data (such as inflation reports, RBI monetary policy changes, and global interest rate movements). These events often lead to volatile intraday price action, conditions under which long-legged doji patterns are more likely to appear. However, volatility can also increase the risk of false signals, making confirmation and volume analysis critical.
Performance on Different Instruments:
Large-cap stocks and indices: Long-legged doji patterns here tend to be more reliable due to higher liquidity and less susceptibility to manipulation.
Small-cap or illiquid stocks: The pattern may appear more frequently but with lower reliability due to erratic price movements, lower volume, and wider spreads.
SEBI’s Surveillance Mechanisms and Volatility Management Tools:
SEBI has implemented several mechanisms - circuit filters, price bands, and volatility indices (e.g., India VIX) to protect market integrity. Traders should always be aware of these when analysing candlestick signals. For instance, a long-legged doji forming near an upper circuit limit may not indicate genuine indecision, but rather regulatory price halting.
Final Thoughts
The long legged doji candlestick provides significant insights when interpreted correctly and paired with supporting indicators. It’s not a standalone signal but becomes highly valuable when used alongside other technical tools.
By understanding the psychology behind the pattern and recognising it in the right market context, traders can enhance their decision-making and increase the chances of catching meaningful reversals.
Frequently Asked Questions (FAQs)
What long-legged doji commonly indicates: bullish or bearish?
It’s neutral by itself. The pattern’s appearance within a trend and the subsequent price action determine if it precedes a bullish or bearish shift.
Is the long legged doji candlestick pattern a viable tool for intraday trading?
Yes, the long legged doji is useful in intraday trading as it highlights short-term market indecision and potential reversals on lower timeframes.
How reliable is the long legged doji candlestick pattern?
When used with other technical indicators, this pattern can be reliable; however, it might produce false signals when used alone in sideways markets.
How does a long-legged doji differ from a regular or standard doji candlestick pattern?
A long-legged doji has much longer upper and lower shadows as compared to a standard doji, signalling higher market volatility and deeper indecision.
Should I buy or sell when I see a long-legged doji?
Avoid immediate action; wait for confirmation from the next candlestick or technical indicators before deciding to buy or sell.
What does a red doji candle mean?
A red doji candle forms when a stock opens and closes at nearly the same price during a session, but closes slightly lower than it opened. This indicates indecision in the market, where buyers and sellers are evenly matched. The red color suggests a minor downward pressure, but not enough to confirm a trend reversal. Traders often wait for the next candle to confirm the market's direction.
Also Read:
| Triple Top Pattern | Shooting Star Candlestick Pattern |
| Hammer Candlestick Pattern | Marubozu Candlestick Pattern |
Related Blog
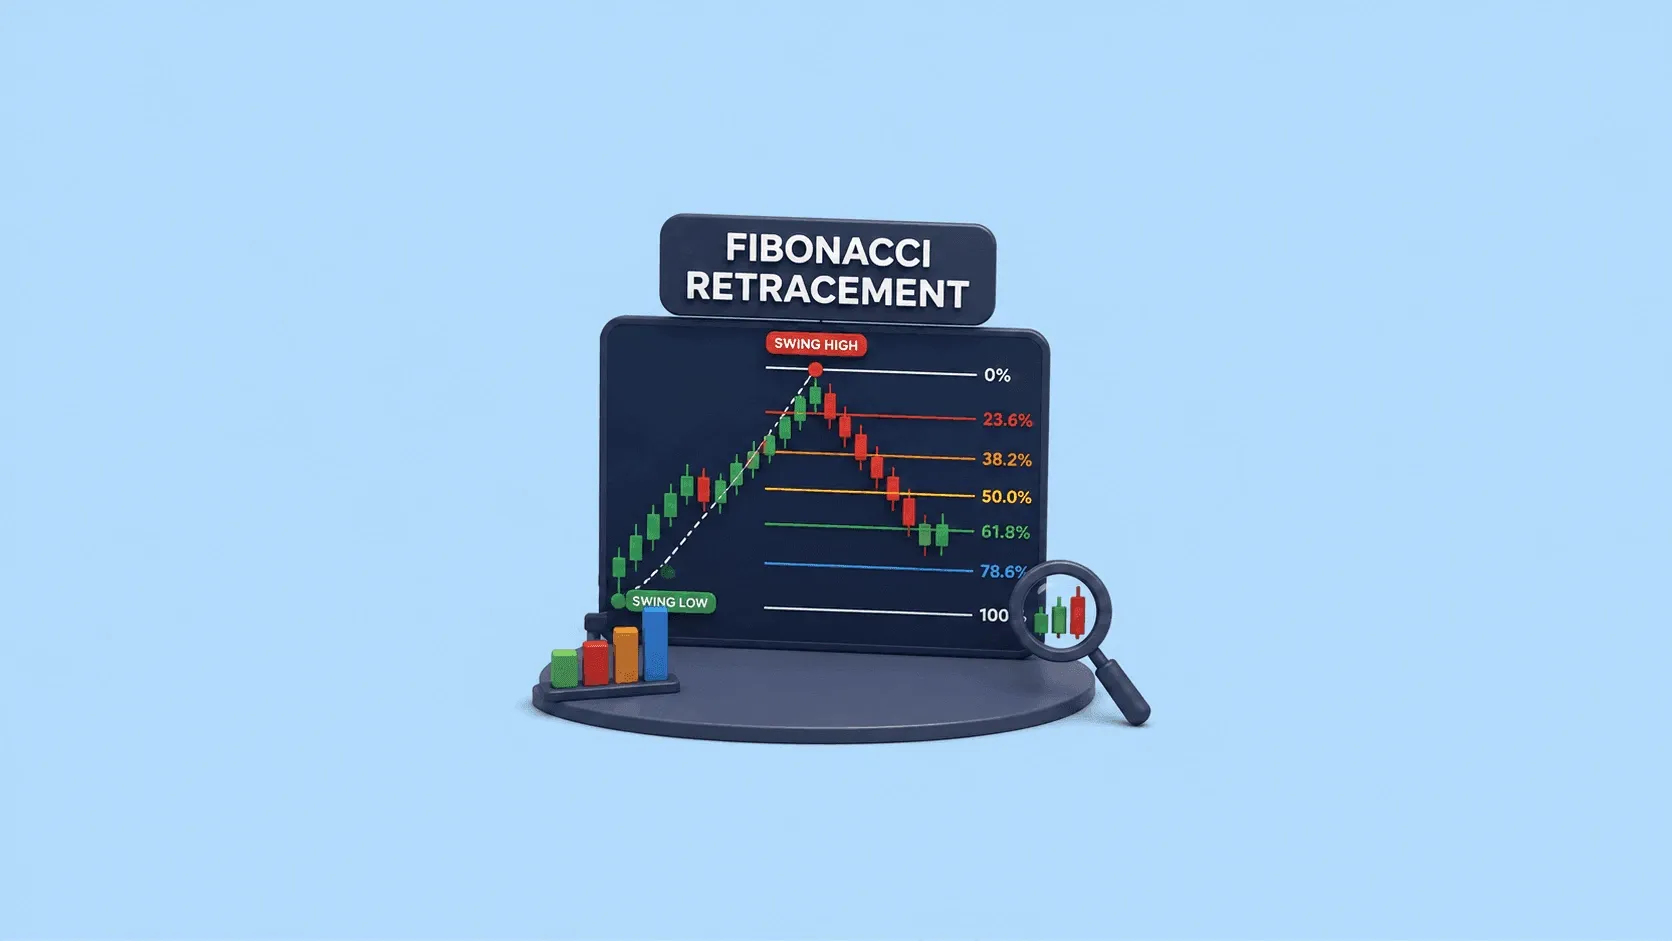
If you are a trader, you may have used technical analysis to analyse price movements and identify potential trading opportunities. While reading about technical analysis, you might have heard of the term “Fibonacci retracement”. But what exactly is it and how is it used? In this blog, we will learn about Fibonacci retracement and understand what the tool does, how it is calculated and how you can use it on a chart. What is Fibonacci Retracement (Fib)? Fibonacci Retracement is a technical ana
23 July 2026
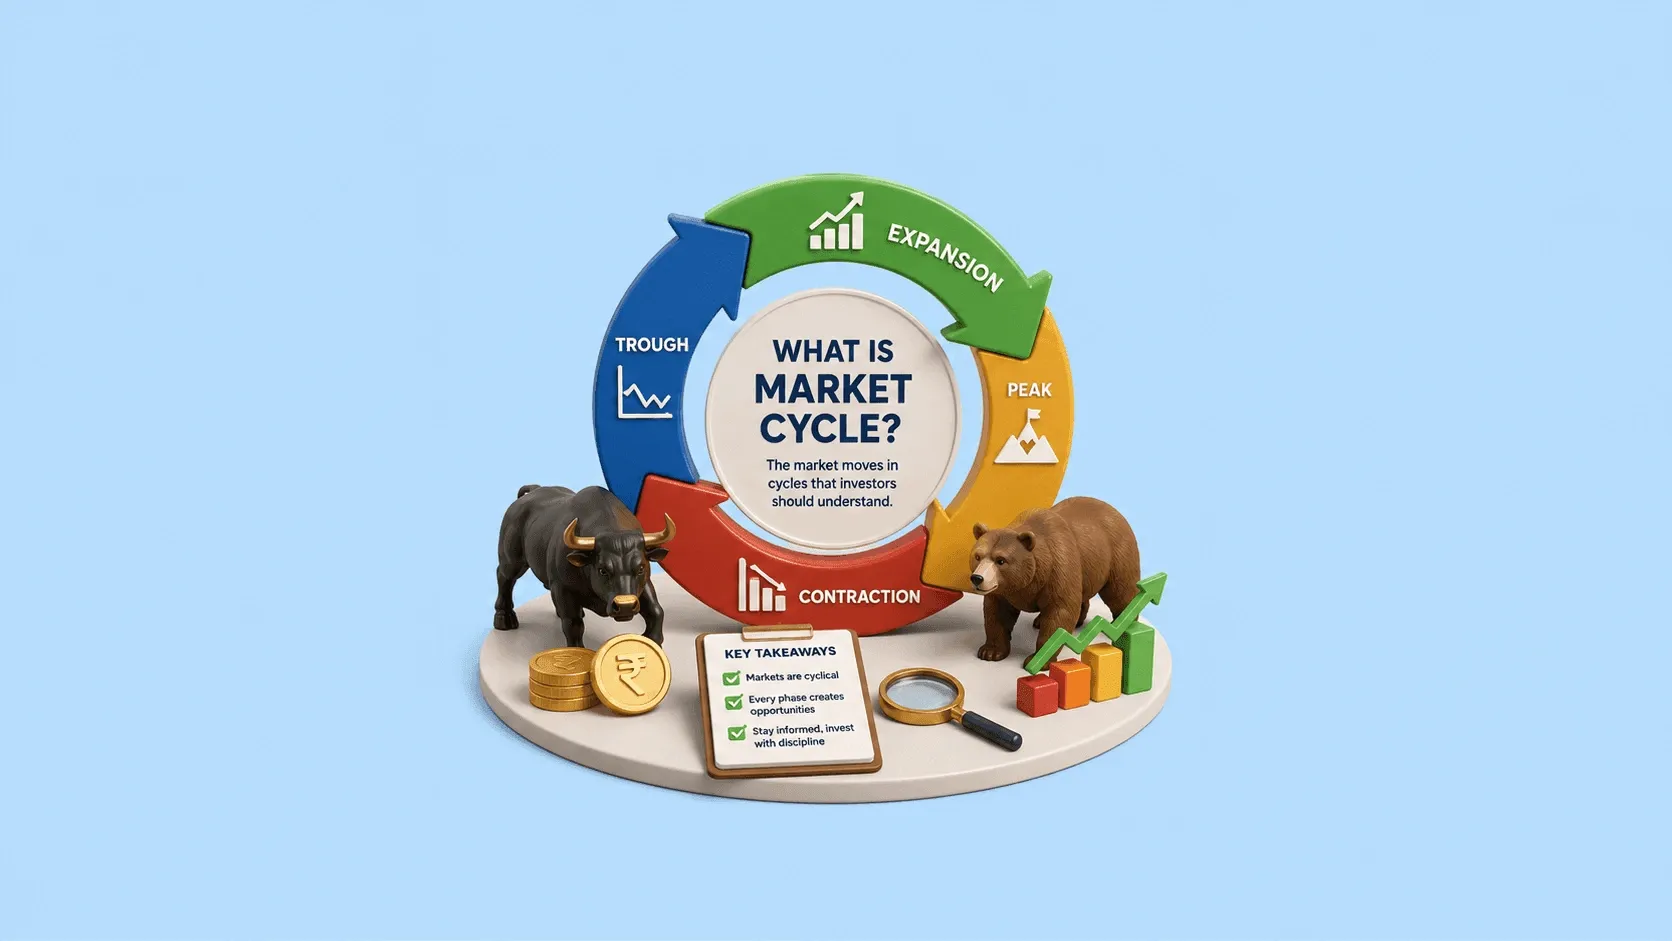
If you’re an investor, you have likely noticed that the market selmdo moves` in a straight line. It rises, falls, consolidates, and then rises again. This repeating pattern isn’t random; it follows recurring patterns, although their duration and intensity vary from one cycle to another. This is known as the market cycle. Understanding this pattern may not always guarantee a profit, but it helps investors and traders to understand the market, rather than reacting emotionally to every news headli
23 July 2026

FII DII Data Today 23rd July 2026 CATEGORY DATE BUY VALUE (₹ Crores) SELL VALUE (₹ Crores) NET VALUE (₹ Crores) DII 23-July-2026 14,716.79 12,008.69 2,708.10 FII 23-July-2026 10,817.61 13,583.31 -2,765.70 What are FII and DII in the Stock Market Foreign Institutional Investors (FIIs) invest in the Indian stock market from international markets, while Domestic Institutional Investors (DIIs) include mutual funds and institutional bodies operating from India. fii dii data helps tra
22 July 2026
Made for Traders.
Trusted by Investors.
Download FinX — trade confidently, invest
smarter, track everything.

Table of Contents
- What is a Doji Candlestick?
- Long Legged Doji Candlestick - Meaning & Features
- Features of a Long Legged Doji Candlestick
- Types of Doji Candlestick Patterns
- Why is the Long-Legged Doji Important in Trading?
- How to Recognise a Long Legged Doji Candle on the Chart?
- How the Long Legged Doji Candlestick Pattern Functions in the Market?
- Effective Trading Strategies Using the Long Legged Doji Candlestick Pattern
- Practical Illustration of the Long Legged Doji Candle in Market Action
- Interpreting the Pattern
- Advantages and Disadvantages of the Long Legged Doji Candlestick Pattern
- Comprehensive Risk Management Framework for Traders
- Understanding the Role of Regulatory Body: SEBI's Importance for Retail Traders
- Key SEBI Guidelines Relevant to Retail Traders:
- Using the Long Legged Doji Pattern in the Indian Stock Market
- Final Thoughts
- Frequently Asked Questions (FAQs)
- Also Read: