
Technical analysis offers traders a powerful method for anticipating market movements, and candlestick patterns are among the most visual tools in this toolkit. Among these patterns, the shooting star candlestick pattern stands out for signalling potential bearish reversals at the peak of an uptrend.
In this article, we’ll explore the shooting star pattern in detail, its structure, interpretation, benefits, and limitations, along with real-world applications to enhance your trading decisions.
What Is a Shooting Star Candle Meaning
A shooting star candle is a single day candlestick formation that appears during an uptrend and suggests that a potential price reversal may be on the horizon. It displays a compact real body situated near the day's lowest price, along with an extended upper shadow and a minimal or absent lower shadow. The shape resembles a falling star, which metaphorically hints that the bullish momentum may be losing steam.
Structure of Shooting Star Candle Stick
Let’s the shooting star candlestick structure:
- Real Body: This part is small, signifying that the opening and closing prices are close to each other.
- Upper Wick (Shadow): Long, showing failed bullish attempt.
- Lower Wick: Barely visible or absent.
- Colour: Can be red or green, but a red candle adds stronger bearish sentiment.
Key Characteristics of a Shooting Star Pattern
For a candle to be confirmed as a shooting star pattern, it is required to meet the following criteria:
- Appears after a consistent uptrend
- The candle has a small body positioned close to its lower end
- The upper shadow extends to at least twice the length of the body
- Minimal or no lower wick
This candlestick reflects an intraday rejection of higher prices, which is why it's considered a warning sign for potential bearish reversals.
What the Shooting Star Candlestick Tells Traders
The shooting star candlestick definition goes beyond shape; it’s about market psychology. It suggests a potential bearish reversal, especially when it follows two or three strong bullish candles marked by higher highs. This pattern begins with the price opening and climbing sharply during the session, reflecting continued buying momentum seen in the prior uptrend. However, by the end of the trading session, selling pressure increases, pulling the price back toward the opening level and indicating a transition in control from buyers to sellers.
The reliability of this reversal pattern is validated by the subsequent candle. If the following session starts with a gap down and ends lower on high trading volume, it strengthens the bearish signal given by the shooting star. This subsequent move often confirms the trend reversal and increases the likelihood of a continued price decline.
Shooting Star Near Resistance Zones
A shooting star chart pattern becomes even more significant when it appears near a known resistance level. Here’s how to identify it:
- The extended upper shadow of a shooting star reflects an attempt by buyers to push the price higher, which was met with significant resistance from sellers. This rejection from higher levels suggests the presence of a resistance area or supply zone.
- The candle finishes close to where it opened, indicating that sellers dominated by the session’s close. This suggests fading bullish strength and a possible change in market direction.
- Traders use this pattern to visually identify resistance levels and evaluate the strength of an ongoing uptrend.
- When seen after a strong upward move, it acts as a warning signal of a possible trend reversal.
- Consequently, traders might scale back their long positions or get ready for a downward price movement.
Example Of Shooting Star Candle:
Let’s say XYZ Ltd. has been on a strong rally, climbing from ₹850 to ₹1,050 over several sessions. As the price approaches ₹1,080, a known resistance zone from past chart history, a shooting star forms on the daily chart. The candle opens at ₹1,065, spikes to ₹1,085 during the day, but closes near ₹1,067 with a long upper shadow and a small body near the bottom.
This price behaviour indicates that buyers initially attempted to push the price higher but faced strong selling pressure. The next day, the stock opens lower and continues to fall, confirming the reversal signal and highlighting that the resistance at ₹1,080 remains intact. Traders interpreting this might reduce their exposure or prepare for a short setup.
How To Trade the Shooting Star Pattern
Trading the shooting star candle pattern successfully requires more than just recognising the pattern; it involves confirmation, proper entry, and disciplined exit strategies. Here's a step-by-step breakdown:
1. Spot the Pattern:
- Start by spotting a well-defined upward trend on the chart.
- Look for a candle with:
Look for a candle with a small body positioned near the session’s low.
Typically, the upper wick is double the length of the candle’s body, with Little to no lower shadow.
- The candle usually appears near the top of an uptrend, signalling possible exhaustion of buying momentum.
2. Confirm the Signal:
- Never rely on the pattern alone. Look for additional evidence to validate the reversal signal:
- An evident rise in trading volume either during or shortly after the candle appears.
- The appearance of a bearish candle after the shooting star adds weight to the reversal indication.
- If the price drops below the low of the shooting star candle, it can act as a further confirmation.
- Consider using technical indicators like RSI or MACD to strengthen your decision-making.
3. Plan Your Entry:
- Traders with a more aggressive approach might initiate their position as soon as the shooting star appears, expecting a trend reversal.
- Conservative traders often wait for more evidence:
- A bearish candle is forming next,
- Or a break below the shooting star’s low to act as a trigger.
- Choose your entry strategy based on your risk appetite and trading style.
4. Define Your Exit Strategy:
- To guard against unexpected price surges, position a stop-loss order just above the shooting star’s peak.
- For taking profits:
- Consider exiting at nearby support zones or previous demand levels.
- Use a trailing stop-loss if you expect a deeper downtrend and want to lock in profits while riding the trend.
- Keep risk-reward ratios in mind to maintain disciplined trading.
Comparing Shooting Star vs Inverted Hammer: Key Difference
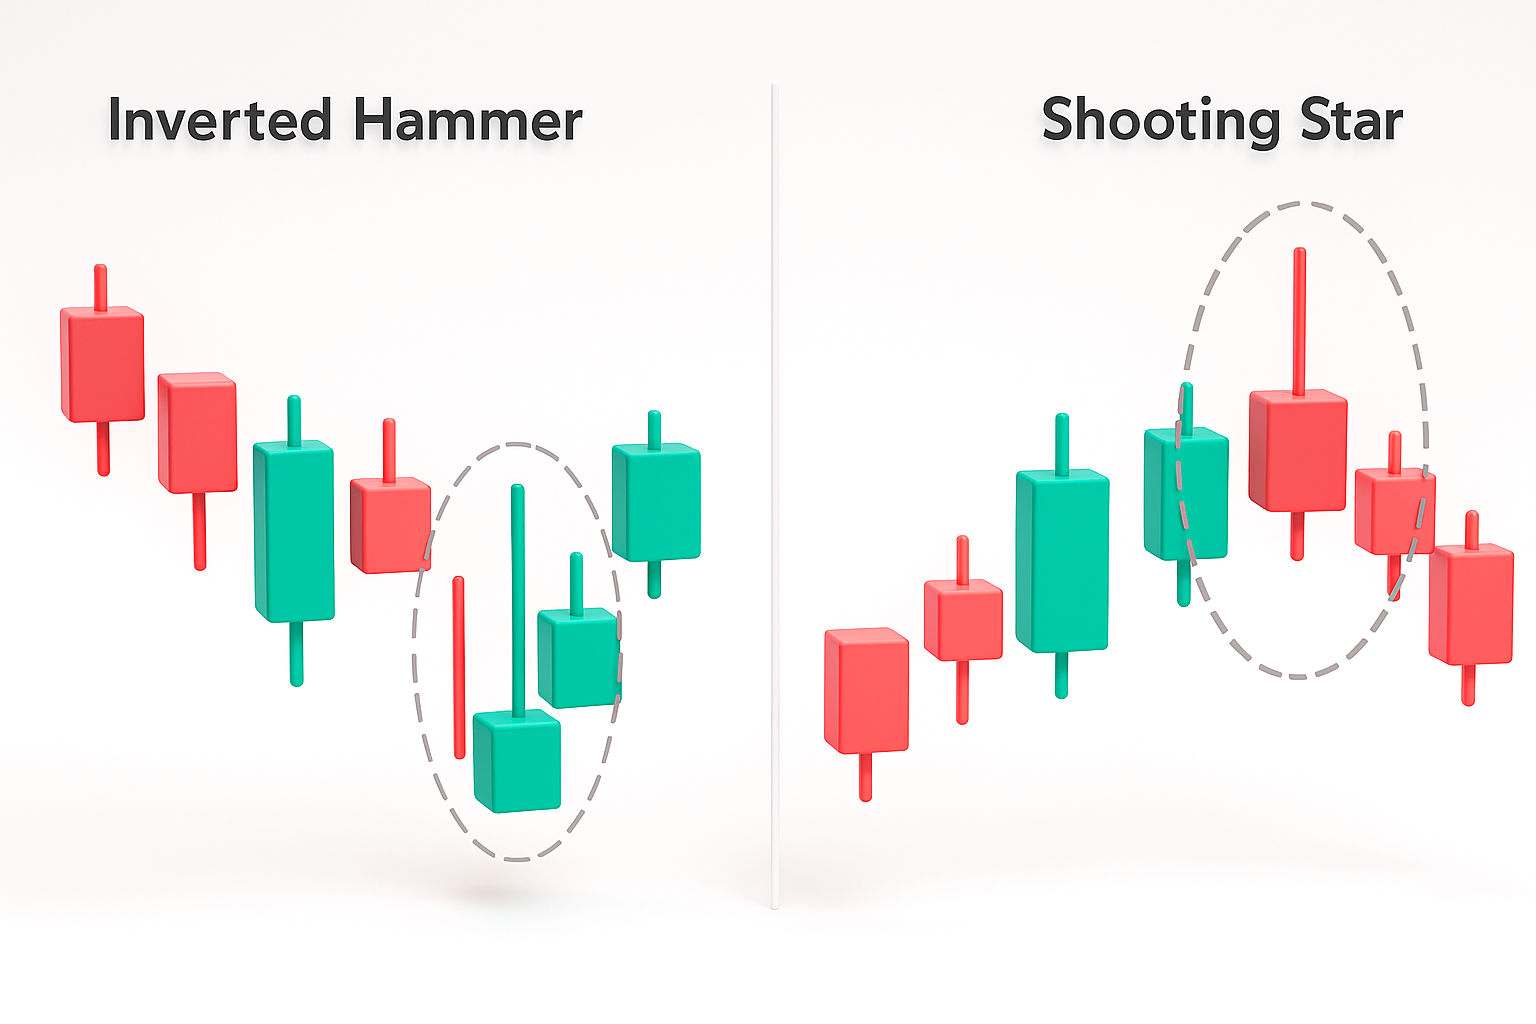
Though they appear visually similar, the shooting star and the inverted hammer - a bullish reversal candlestick seen after a downtrend - serve different purposes based on their market context and implications.
| Feature | Shooting Star | Inverted Hammer |
|---|---|---|
| Trend Context | Forms after an uptrend | Forms after a downtrend |
| Signal | Indicates a potential bearish reversal | Indicates a potential bullish reversal |
| Market Sentiment | Suggests buyers lost control | Suggests sellers lost control |
| Trading Approach | Used to exit long positions or prepare for short entries | Used to enter long positions anticipating a reversal |
| Confirmation Needed | Validated by a downward-moving candle or a gap lower | Validated by an upward-moving candle or a gap higher |
Advantages of Using the Shooting Star Candle Pattern
Here’s why many traders trust this pattern:
- Early Reversal Signal: Helps catch the top of a rally.
- Simple to Identify: Easy to spot even for beginners.
- Works on Multiple Timeframes: From daily charts to intraday.
- Low Risk Entry Point: With clear stop-loss placement.
- High Reward Potential: Especially when confirmed with volume or resistance.
Limitations of the Shooting Star Candle Pattern
Like any technical tool, this pattern has its downsides
- False Signals: Without confirmation, it may mislead.
- No Volume Clue: Doesn’t always indicate institutional selling.
- Short-Term Signal: Might not reflect long-term trend reversal.
- Needs Context: Works best with indicators like RSI, MACD, or trendlines.
Use it as one piece of a larger technical puzzle, not a standalone signal.
Final Thoughts
The shooting star candlestick pattern is a well-known and dependable indicator for identifying possible bearish reversals, particularly following an upward price movement. While powerful, its real value emerges when used alongside resistance levels, volume data, and confirmation candles. By integrating it thoughtfully into a broader strategy, traders can improve timing and risk management in volatile markets.
Also Read About: Triple Top Pattern
Frequently Asked Questions (FAQs)
Can the shooting star candlestick pattern be effectively used in day trading?
Yes, but only when confirmed by volume or a follow-up bearish candle. It works well on intraday charts like 15-minute or hourly frames.
Can a green candle be a shooting star?
Yes, provided it exhibits a small real body positioned near its lower and a pronounced upper wick. However, a red body indicates stronger bearish sentiment.
What is a bearish and bullish shooting star?
A bearish shooting star appears after an uptrend, suggesting a possible reversal to the downside. This indicates that sellers are gaining control. A bullish shooting star is less common and usually refers to a false signal where the price recovers after the pattern, continuing the uptrend despite initial selling pressure.
How does volume affect the validity of a shooting star candle?
Higher volume during the formation enhances the signal’s reliability, as it may indicate strong selling interest at higher prices.
Can the shooting star candlestick pattern be applied reliably in crypto and forex markets?
Yes, you can. The pattern is based on price action and works across asset classes, including stocks, forex, and crypto.
Also Read:
Related Blog
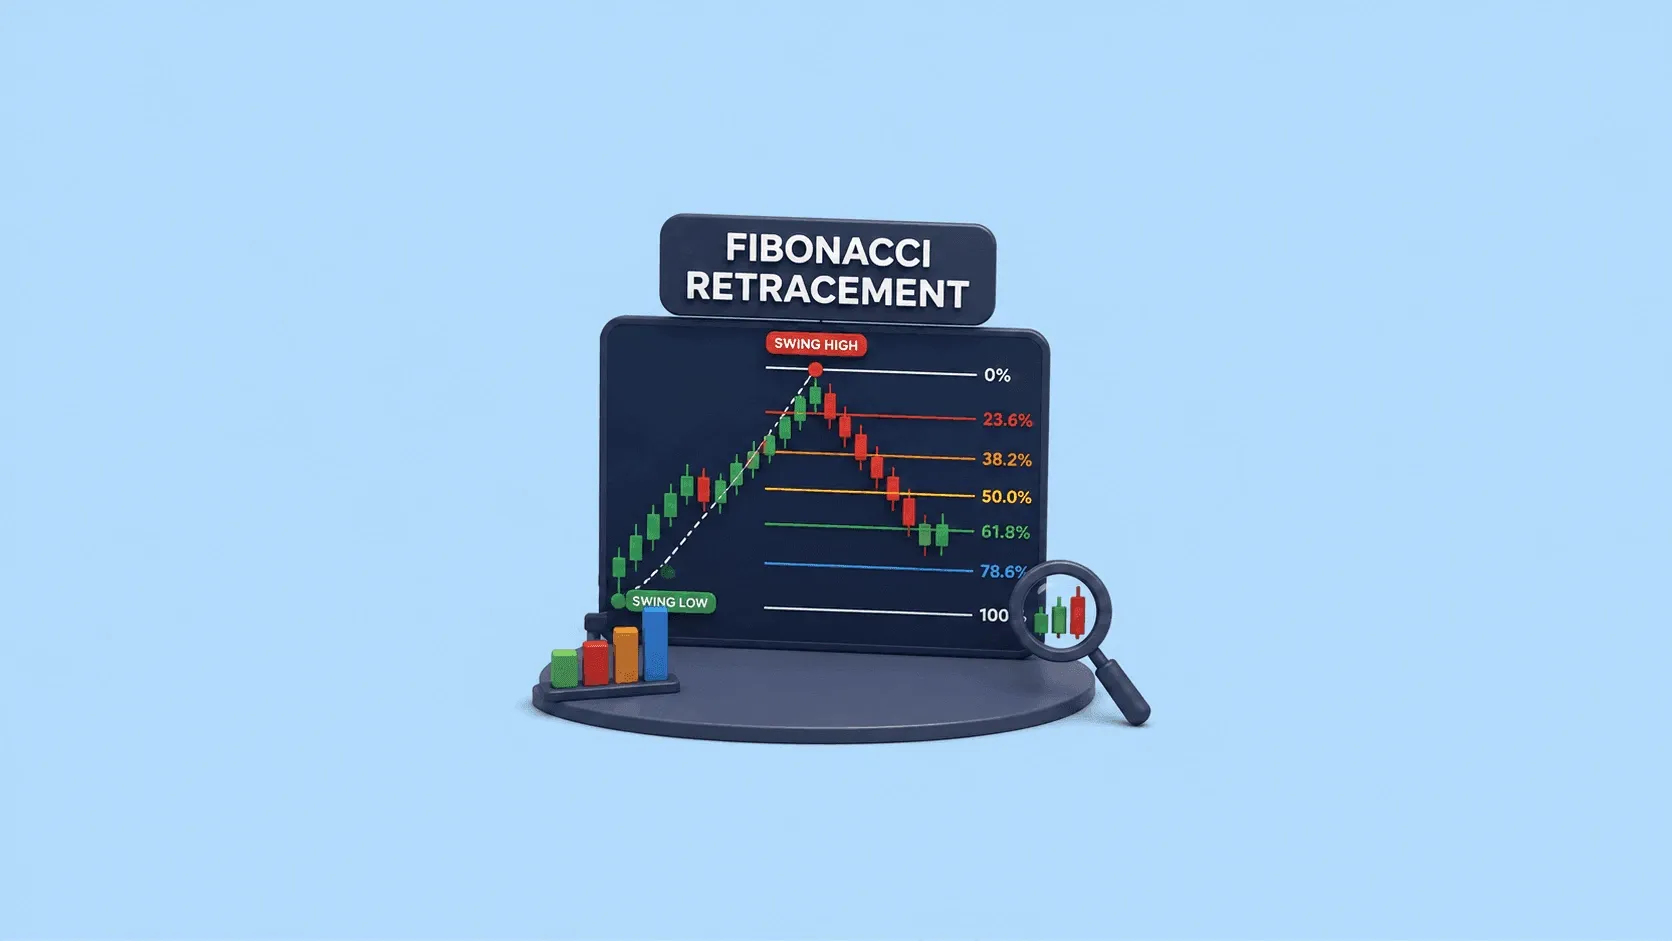
If you are a trader, you may have used technical analysis to analyse price movements and identify potential trading opportunities. While reading about technical analysis, you might have heard of the term “Fibonacci retracement”. But what exactly is it and how is it used? In this blog, we will learn about Fibonacci retracement and understand what the tool does, how it is calculated and how you can use it on a chart. What is Fibonacci Retracement (Fib)? Fibonacci Retracement is a technical ana
23 July 2026

If you’re an investor, you have likely noticed that the market selmdo moves` in a straight line. It rises, falls, consolidates, and then rises again. This repeating pattern isn’t random; it follows recurring patterns, although their duration and intensity vary from one cycle to another. This is known as the market cycle. Understanding this pattern may not always guarantee a profit, but it helps investors and traders to understand the market, rather than reacting emotionally to every news headli
23 July 2026

FII DII Data Today 23rd July 2026 CATEGORY DATE BUY VALUE (₹ Crores) SELL VALUE (₹ Crores) NET VALUE (₹ Crores) DII 23-July-2026 14,716.79 12,008.69 2,708.10 FII 23-July-2026 10,817.61 13,583.31 -2,765.70 What are FII and DII in the Stock Market Foreign Institutional Investors (FIIs) invest in the Indian stock market from international markets, while Domestic Institutional Investors (DIIs) include mutual funds and institutional bodies operating from India. fii dii data helps tra
22 July 2026
Made for Traders.
Trusted by Investors.
Download FinX — trade confidently, invest
smarter, track everything.

Table of Contents
- What Is a Shooting Star Candle Meaning
- Structure of Shooting Star Candle Stick
- Key Characteristics of a Shooting Star Pattern
- What the Shooting Star Candlestick Tells Traders
- Shooting Star Near Resistance Zones
- How To Trade the Shooting Star Pattern
- Comparing Shooting Star vs Inverted Hammer: Key Difference
- Advantages of Using the Shooting Star Candle Pattern
- Limitations of the Shooting Star Candle Pattern
- Final Thoughts
- Frequently Asked Questions (FAQs)