
Technical analysts frequently rely on candlestick charts due to their ability to visually convey market sentiment and price dynamics. Among the various patterns these charts highlight, the spinning top candlestick stands out for signalling indecision in the market. This pattern may indicate that a current trend is losing strength, hinting at either a possible pause or a shift in direction, depending on surrounding market conditions.
This blog delves into the spinning top candlestick pattern meaning, how it forms, how to identify and trade it, and its relevance under current market conditions.
Spinning Top Candlestick Meaning
A spinning top candlestick features a small real body positioned near the centre of the candle, with extended wicks on both the upper and lower ends. This formation indicates a period of market uncertainty.
The pattern emerges when both buyers and sellers exert pressure in opposite directions during the same session, buyers driving prices higher and sellers pulling them lower, resulting in a close that’s nearly equal to the open. When it appears after a strong upward or downward movement, it may suggest a potential shift in trend. However, this signal should be confirmed by the following candlestick before considering any trading action.
Features of a Spinning Top Candle
While spinning tops are visually intuitive, having concrete identification rules makes pattern recognition more consistent, especially for newer traders. Here's how you can reliably identify one:
| Feature | Quantitative Criteria |
|---|---|
| Real Body | The real body (distance between open and close) should account for less than 25–30% of the total candlestick range. |
| Shadows (Wicks) | Both upper and lower shadows should be at least twice the length of the real body. In pip terms, if the body is 5 pips, shadows should be 10+ pips. |
| Symmetry | The upper and lower shadows should be roughly equal in length, allowing for slight deviations of around 10–15%. |
| Contextual Placement | Spinning tops are more meaningful when they appear after extended bullish or bearish moves, suggesting exhaustion and possible reversal. |
These measurable benchmarks help distinguish spinning tops from similar patterns, such as dojis or long-legged candlesticks.
Types of Spinning Top Candlesticks Pattern
Now that we understand the spinning top candlestick meaning, let's look at its two main types: the Bearish Spinning Top and the Bullish Spinning Top patterns.
- Bullish Spinning Top Pattern: This variation appears when the market closes just above its opening price. It suggests buyers had a modest edge during the session, though the long shadows still point to significant price swings and a lack of firm control.
- Bearish Spinning Top Pattern: This type of spinning top forms when the closing price is marginally lower than the opening price. It points to a slight dominance by sellers during the trading period. Nonetheless, the presence of long upper and lower shadows signals a back-and-forth struggle between market participants, underscoring overall indecision rather than strong bearish momentum.
Despite these distinctions, both versions of the spinning top candle emphasise hesitation in the market, and their true significance is better understood when viewed alongside surrounding candlesticks and overall trend direction.
Spinning Top Candlestick Pattern - Formation
The price action within a spinning top candlestick indicates an ongoing struggle between buyers and sellers. Both sides exert pressure, resulting in the closing price staying near its opening level. This tug-of-war results in a pattern where no significant progress is made in either direction. Incorporating the spinning top into a broader trading strategy can assist traders in navigating short to medium-term investment opportunities with caution.
The core concept of the spinning top lies in market indecision - during the session, bullish participants drive prices upward while bearish pressure forces them down. This back-and-forth movement causes the candle to settle near its opening level by the close. Occasionally, bulls manage to push prices slightly higher again before the session ends, but not with enough strength to define a clear trend.
When this pattern emerges following a sustained uptrend or downtrend, it often signals that market momentum may be weakening. The narrow distance between the open and close points on the candle shows that little net change occurred, despite considerable volatility. The elongated upper and lower shadows illustrate how both bullish and bearish forces were active, but neither side gained a decisive edge during the trading period.
How to Identify the Spinning Top Candlestick Pattern?
Recognising a spinning top candlestick pattern involves focusing on three key aspects:
Position in the Trend:
This candlestick can form within any ongoing market trend. If it shows up during a downtrend, it could indicate a possible bullish reversal. If observed within a rising market, the spinning top could suggest that buying pressure is fading, possibly leading to a reversal in direction.
Distinctive Appearance:
The spinning top is most easily identified by its structure: a small real body centred between two long shadows. The extended shadows illustrate that the market swung between highs and lows during the session, showing no clear directional control.
Underlying Interpretation:
This pattern represents a temporary state of equilibrium in the market, where buyers and sellers exert nearly equal pressure. As a result, the session ends with little change from the opening price, highlighting market indecision and potential for a shift in direction.
Interpreting Market Psychology Through the Spinning Top Candlestick
The spinning top candlestick reflects market participants’ uncertainty and emotional tug-of-war during a particular trading period. Its small real body, combined with long upper and lower wicks, visually represents a period of uncertainty and indecision among traders.
This candlestick pattern shows that both buyers and sellers actively fought for control over price movement throughout the session. Buyers attempted to push the price upward, while sellers applied downward pressure. Despite these efforts, the trading day concluded with the price settling close to where it began, demonstrating a lack of clear dominance by either side. This equilibrium reflects a neutral market outlook, highlighting hesitation about the next directional move.
When a spinning top emerges after a pronounced upward or downward trend, it can signal a slowdown in momentum, suggesting that the existing trend may be losing strength. This situation could prompt either a pause or a shift backwards. However, relying on this pattern alone is not sufficient for decision-making. Traders often wait for additional confirmation, such as a follow-up candlestick or signals from complementary technical tools, before determining the most probable future price trajectory.
Trading Strategies For Spinning Top Candlestick Pattern
Understanding how to read a spinning top candlestick and apply it in trading is essential for any technical analyst. A spinning top forms when the market shows a tug-of-war between buying and selling pressure, resulting in a neutral candle. The key takeaway is that neither buyers nor sellers have full control. However, its location within the prevailing trend is crucial for interpreting its meaning and making informed trading decisions.
When this pattern appears after a strong move, whether upward or downward, it often points to a potential trend reversal or temporary pause. A confirmation candle following the spinning top is necessary before acting on the signal, as the pattern alone does not guarantee a directional shift.
Unlike patterns such as the Marubozu candle, which indicate momentum and help with identifying precise entry and exit levels, the spinning top is more ambiguous. It commonly appears in situations where the market is facing indecision or hesitation.
Strategic Approaches to Trading the Spinning Top Candle
Below are practical steps to incorporate this pattern into your trading strategy:
- Look for Confirmation: The small body of the spinning top highlights that the opening and closing prices are close together, while the long wicks reflect considerable volatility. The long shadows on either end reflect heightened price swings during the session. To improve the reliability of this signal, it's wise to pair it with technical indicators such as volume analysis or momentum oscillators.
- Analyse Trend Position: If a spinning top develops near the end of a downtrend, it may signal bullish reversal potential. A commonly used tool to confirm this setup is the stochastic oscillator, which tracks the speed and direction of price movement over a defined period. If the indicator confirms the reversal, traders with higher risk tolerance may consider holding the position longer. More cautious traders may wait for further validation from the next candlestick pattern.
- Evaluate Trend Strength: While spinning tops can hint at a trend change, these patterns are most effective when they appear after a prolonged trend showing signs of weakening. If the existing trend remains strong without evidence of slowing, the price will likely continue in the same direction. That's why it’s important to assess overall market momentum before reacting.
- Combine with Other Tools: For a more comprehensive analysis, the spinning top should be used in conjunction with other technical tools, such as support and resistance zones, the Relative Strength Index (RSI), or moving averages. This combined approach can help filter out false signals and align trades with broader market conditions.
Real-World Example of a Spinning Top Candlestick Pattern
Let’s walk through a detailed scenario that illustrates how a spinning top candlestick can indicate a possible shift in market sentiment.
Stock XYZ Ltd. had been in a strong uptrend, rising steadily from ₹220 on 1 March 2025 to ₹270 by 14 March 2025. The uptrend showed consistent buying with increasing momentum over several sessions.
Spinning Top Formation – 14 March 2025 (Daily Chart)
On 14 March 2025, the following price action was recorded:
- Open: ₹268
- High: ₹275
- Low: ₹263
- Close: ₹267
- Volume: 2.2 million shares (significantly above the 10-day average of 1.4 million)
The candle formed with a narrow body flanked by long shadows both above and below, typical of a spinning top pattern. The increased volume that day suggested considerable market activity, with both buyers and sellers aggressively contending for dominance, yet ultimately reaching an indecisive close.
Interpretation:
The spinning top appeared after a sustained rally, signalling market indecision. The long wicks suggested sharp intraday price swings, but the near-identical open and close showed hesitation. When this kind of pattern forms after an uptrend, it can be a warning sign of bullish fatigue.
What Happened Next – 15 March 2025
On 15 March 2025, the very next trading session, XYZ opened at ₹266 and dropped sharply to close at ₹258:
- Open: ₹266
- High: ₹267
- Low: ₹256
- Close: ₹258
- Volume: 3.1 million shares (well above average, confirming bearish conviction)
This bearish confirmation candle broke below the spinning top’s low of ₹263 with strong volume, reinforcing the possibility of a short-term trend reversal. Over the next four sessions, XYZ retraced to ₹246 before finding support.
Analytical Takeaway:
- The high volume on the spinning top day signalled a struggle between buyers and sellers, not a quiet pause.
- The even higher volume on the confirmation candle gave weight to the bearish reversal, reflecting stronger seller intent.
- The pattern was validated by a follow-through candle, aligning with disciplined candlestick strategy principles.
Note: The example is hypothetical but constructed in a realistic market context to illustrate the concept. Never rely solely on technical analysis; pair it with broader risk management methods.
Benefits of Using the Spinning Top Candlestick Pattern
Applicable Across Timeframes: The spinning top candlestick pattern can be observed on various chart intervals, ranging from intraday to weekly, making it suitable for both short-term and long-term trading strategies.
- Signals Possible Trend Fatigue: The emergence of a spinning top after a pronounced trend could signal that the current movement is fading. This gives traders a potential early warning of a trend reversal.
- Helps Identify Market Pause Points: The pattern often marks a moment of indecision or equilibrium between buyers and sellers, helping traders identify when a market might be pausing before making its next major move.
- Useful in Volatile Conditions: The wide price fluctuations within the candle highlight underlying market volatility, which can be valuable for volatility-based strategies and risk-reward analysis.
- Facilitates the Timing of Trades: While the pattern does not give specific entry or exit signals, it can enhance trade timing when combined with other indicators, offering a chance to prepare for upcoming price action shifts.
Limitations of the Spinning Top Candelstick Pattern
- Requires Confirmation to Be Reliable: The spinning top by itself is not a strong directional indicator. Traders must wait for a confirmation candle to support any reversal or continuation thesis, making it less actionable on its own.
- High Frequency Reduces Significance: These patterns appear frequently on price charts, and many instances may not carry meaningful signals. Relying solely on this candlestick without broader context may lead to misleading conclusions.
- Lacks Defined Price Target: The spinning top candlestick does not indicate potential profit targets or stop-loss levels, making it difficult to assess the risk-to-reward ratio without additional tools or strategies.
- Limited Predictive Power in Sideways Markets: The pattern may form during periods of consolidation or low volatility, where price action remains range-bound. In such cases, its predictive value is greatly reduced.
- Challenging Candle Size: Although the body is small, the total range from high to low can be quite large, especially in volatile markets. This can create challenges when placing stop-loss orders or managing risk, particularly for traders using tighter control over trade sizing.
Managing Risk with Spinning Top Setups
While spinning top candlesticks offer valuable insight into market indecision, trading them without a disciplined risk management plan can lead to avoidable losses. Because this pattern reflects uncertainty rather than strong directional bias, it’s essential to pair it with a cautious and strategic approach.
To trade spinning top patterns responsibly, it’s essential to follow structured risk management practices that minimise exposure and increase decision-making confidence.
Wait for Confirmation Before Entering a Trade:
Spinning top candlesticks generally represent a point of market balance, where neither buyers nor sellers secure a definitive upper hand. Because of their neutral nature, it's important not to jump to conclusions based on the spinning top alone. Instead, traders should look for confirmation in the following candle to better assess the likely direction, whether upward or downward. This approach reduces the potential for reacting to a deceptive signal.
For example:
If the market has been falling for a while, the formation of a spinning top might indicate a pause in momentum and the possibility of an upcoming bullish move. However, it's advisable to wait for a bullish confirmation candle, one that closes above the spinning top's high, before considering a long trade. This approach improves the reliability of the signal and helps you enter the trade with greater confidence.
Define Entry and Exit Points Strategically:
As this candlestick pattern doesn't inherently suggest specific reversal or price targets, traders often rely on known support and resistance areas to guide order placement and determine potential stop-loss and profit-taking levels.
- Entry: Place buy/sell orders after confirmation, ideally above/below the high/low of the spinning top candle.
- Stop-Loss: One standard tactic is placing the stop-loss just outside the candle’s opposite wick to protect against significant losses.
Use Risk-Reward Ratios to Evaluate Trade Viability:
A minimum risk-to-reward ratio of 1:2 is often advisable. If a trade doesn’t meet this criterion, it may not be worth pursuing, even if the setup looks favourable. Use position sizing calculators and volatility measures (like ATR) to fine-tune your trade parameters.
Incorporate Volume for Added Confirmation:
Volume can be a crucial secondary indicator. A spinning top formed on low volume might signal weak conviction, whereas one with high volume, especially followed by a strong confirmation candle, can indicate that a genuine shift is underway. Align your risk exposure accordingly.
Adapt Based on Market Environment:
Spinning tops behave differently depending on broader market dynamics:
- In strong trends, they may signal brief pauses rather than full reversals.
- In ranging markets, they may appear more frequently and provide less predictive value.
Tailoring your position size and stop placement based on trend strength and market volatility helps avoid overexposure.
Use Additional Indicators for Confluence:
To increase reliability, combine the spinning top setup with momentum indicators like the Stochastic Oscillator, RSI, or MACD. This added confluence can help filter out weak signals and improve the overall probability of success.
Practice with Paper Trading or Small Position Sizes:
For less experienced traders or those testing new strategies, consider using a demo account or smaller trade sizes until you’ve observed the pattern’s behaviour in different market conditions. This helps build confidence without excessive risk.
Risk Disclaimer: Trading involves inherent financial risk. Patterns like the spinning top are not guarantees of future performance. Always conduct a thorough analysis and consider consulting a licensed financial advisor before acting on technical signals.
Market Environment and Regulatory Landscape in India
When interpreting and applying spinning top candlestick patterns in the Indian markets, traders must account for both current market conditions and the regulatory framework that governs financial activity. A pattern’s effectiveness can vary significantly based on economic sentiment, liquidity, and compliance obligations.
Economic Backdrop Shapes Pattern Reliability:
The reliability of spinning top candlestick patterns often hinges on the macroeconomic environment and sector-specific sentiment. In India, the following events can increase volatility and cause patterns like spinning tops to emerge more frequently, though not always meaningfully.
- RBI monetary policy announcements
- Inflation data (CPI, WPI)
- GDP releases and fiscal budget updates
- Global commodity price changes (especially crude oil)
In such times, traders should avoid interpreting every spinning top as a trade-worthy signal without confirmation.
Volume and Liquidity Considerations in Indian Stocks:
Liquidity on platforms such as NSE and BSE often differs significantly depending on whether the stock is large-cap, mid-cap, or small-cap. A spinning top candle on a high-volume stock carries more analytical weight than one formed on a thinly traded SME stock.
Before placing a trade based on the pattern:
- Review average daily trading volume.
- Consider F&O participation (if applicable).
- Check intraday volatility during the candle formation.
In India’s often sentiment-driven retail environment, low-volume spinning tops are more prone to misinterpretation.
SEBI Regulations:
The Securities and Exchange Board of India (SEBI) sets clear regulations that impact how technical analysis strategies, like those based on spinning top candlestick patterns, should be communicated, executed, and disclosed.
Key SEBI compliance points:
- Leverage limits: Traders using margin or derivatives must operate within SEBI’s risk-based margin framework.
- Research analyst regulations: Only SEBI-registered individuals/entities can issue public trading recommendations or stock calls.
- Advisory disclaimers: Educational content must include proper risk disclaimers and avoid promising returns or guaranteed outcomes.
- Pattern Day Trading: While not explicitly regulated like in the U.S., frequent trading behaviour is monitored, and margin misuse can trigger penalties.
For educators, influencers, and financial advisors: ensure all trading education is transparent, fact-based, and avoids speculative advice without disclaimers.
Trading in Volatile or News-Driven Conditions:
India’s markets are highly reactive to news cycles, such as:
- Election outcomes
- Budget announcements
- PSU privatisation talks
- Global cues from the US Fed or geopolitical risks
In such environments, spinning top patterns may form due to short-term volatility rather than true market indecision. Confirm trades with supporting indicators like RSI, MACD, or price-volume action.
Risk-Aware Use of Spinning Top Setups:
Indian traders, especially those new to candlestick-based strategies, must integrate basic risk management:
- Implementing stop-loss orders and carefully adjusting position sizes can help prevent excessive exposure to market risk.
- Avoid overtrading based on back-to-back spinning tops—especially in sideways or low-volume phases.
- Evaluate the pattern across multiple timeframes (15-min, hourly, daily) for better clarity.
Wrapping Up:
The spinning top candlestick pattern provides significant insight into market indecision, proving to be a valuable tool when carefully incorporated into a comprehensive trading strategy. While the pattern alone doesn't provide definitive buy or sell signals, its real strength lies in signalling a potential pause, reversal, or weakening momentum, especially when it appears after extended trends.
To use spinning tops effectively:
- Always assess their placement within the trend.
- Always seek validation from later candlesticks or supporting technical indicators before acting on the spinning top pattern.
- Enhance the reliability of the signal by combining the spinning top pattern with volume data, key support and resistance zones, and momentum indicators such as RSI or the stochastic oscillator.
Ultimately, successful use of the spinning top candlestick pattern doesn’t come from spotting it in isolation, but from contextualising it within price action, trend strength, and risk management. When combined with sound strategy and responsible execution, this humble candle can become a sharp signal in your trading toolkit.
Frequently Asked Questions (FAQs)
What is the spinning top candlestick's meaning in trading?
It represents market indecision, where both buyers and sellers failed to dominate the session.
How do I confirm a spinning top signal?
By observing the next few candles for directional confirmation, especially in context with trendlines or support/resistance levels.
Can a spinning top occur in any timeframe?
Yes, spinning tops appear in all timeframes, from 1-minute charts to weekly ones, but are most reliable on daily or longer intervals.
What Sets a Spinning Top Apart from a Doji?
While both candlestick patterns indicate market uncertainty, a Doji shows nearly identical opening and closing prices, resulting in a virtually nonexistent body. In contrast, a spinning top has a small but visible body, reflecting minor progress by either buyers or sellers. Though similar in signalling indecision, their impact and interpretation can vary depending on context.
Should I trade immediately after spotting a spinning top candle?
No. It's best to wait for confirmation and analyse the broader context before making any trade decisions.
Related Blog
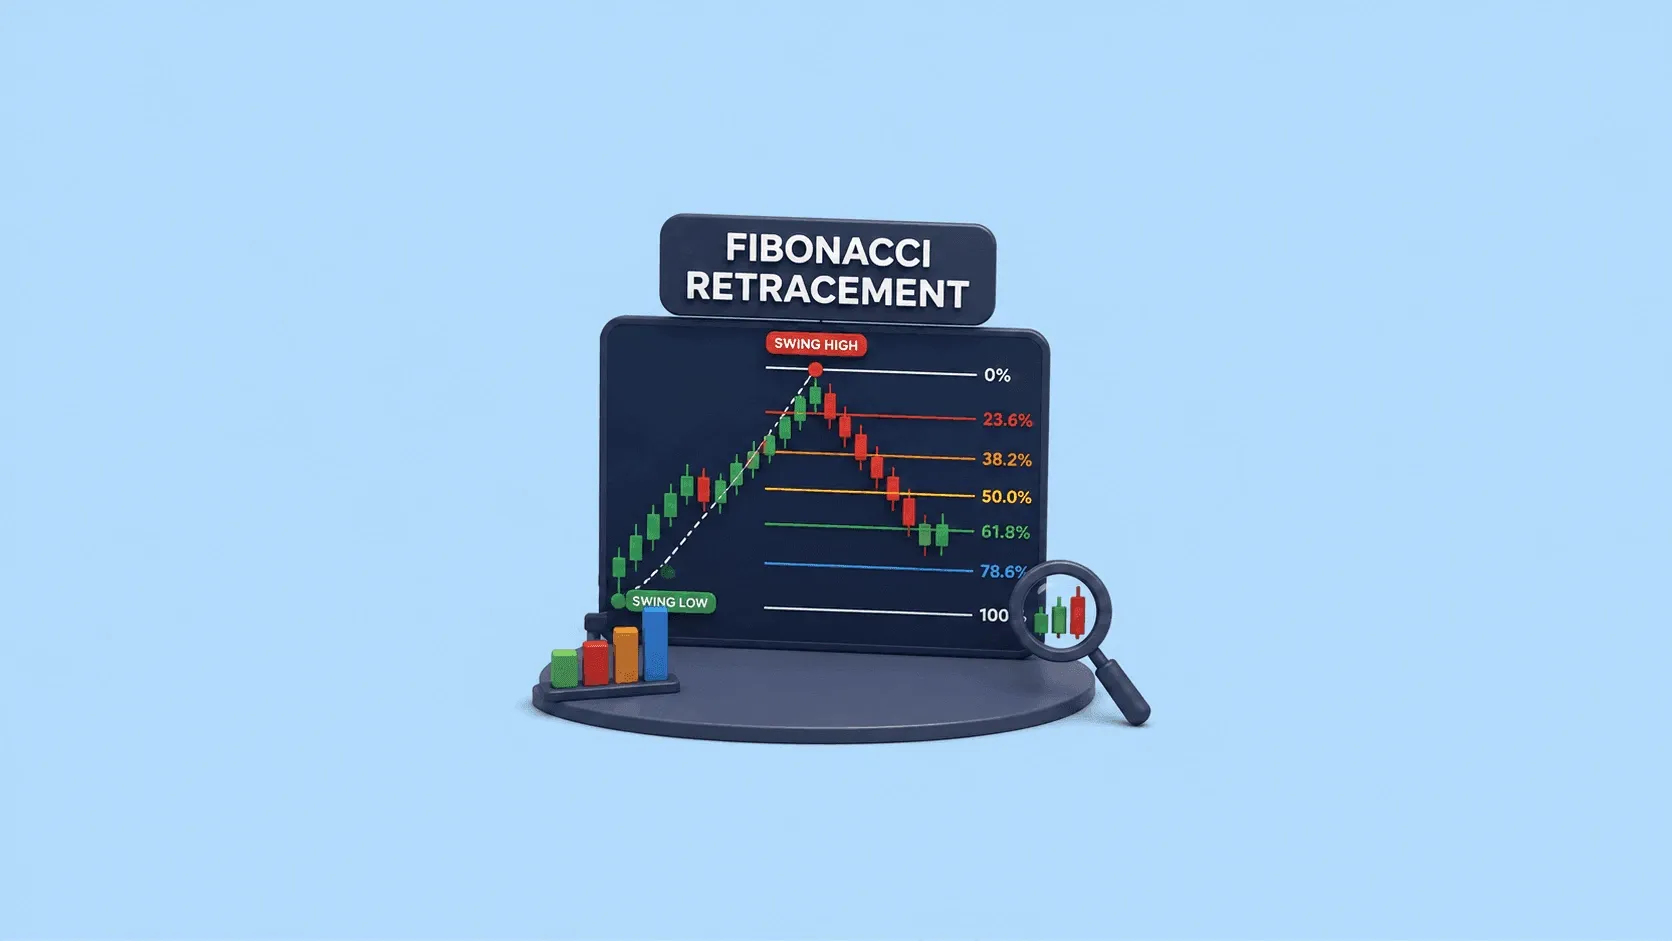
If you are a trader, you may have used technical analysis to analyse price movements and identify potential trading opportunities. While reading about technical analysis, you might have heard of the term “Fibonacci retracement”. But what exactly is it and how is it used? In this blog, we will learn about Fibonacci retracement and understand what the tool does, how it is calculated and how you can use it on a chart. What is Fibonacci Retracement (Fib)? Fibonacci Retracement is a technical ana
23 July 2026
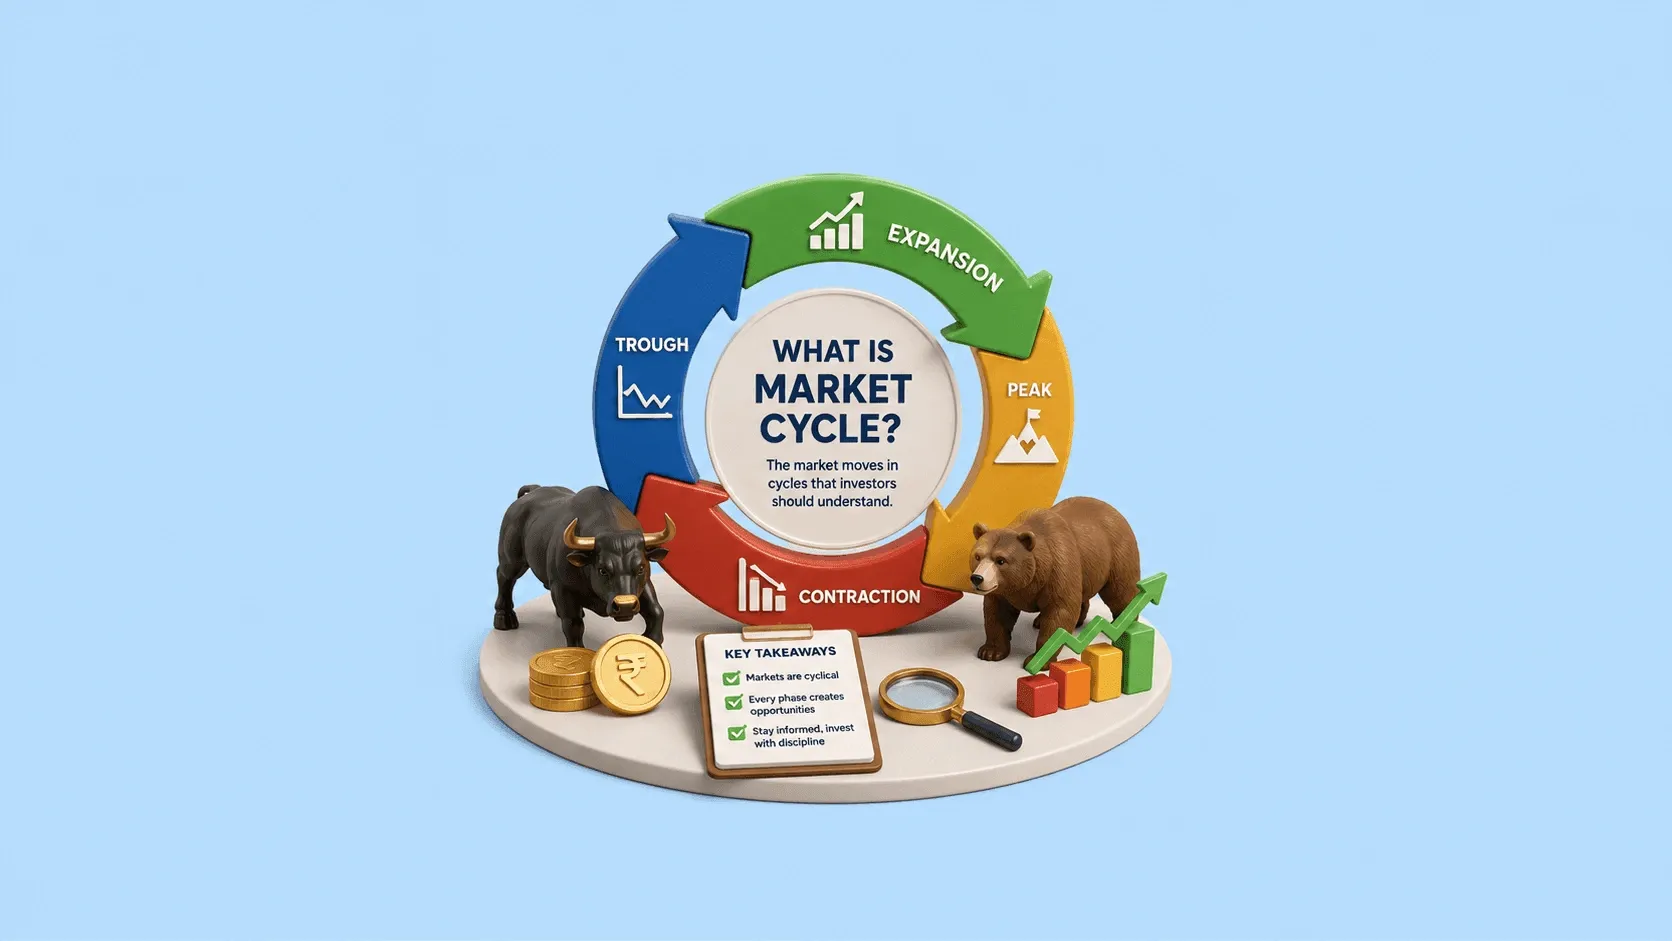
If you’re an investor, you have likely noticed that the market selmdo moves` in a straight line. It rises, falls, consolidates, and then rises again. This repeating pattern isn’t random; it follows recurring patterns, although their duration and intensity vary from one cycle to another. This is known as the market cycle. Understanding this pattern may not always guarantee a profit, but it helps investors and traders to understand the market, rather than reacting emotionally to every news headli
23 July 2026

FII DII Data Today 23rd July 2026 CATEGORY DATE BUY VALUE (₹ Crores) SELL VALUE (₹ Crores) NET VALUE (₹ Crores) DII 23-July-2026 14,716.79 12,008.69 2,708.10 FII 23-July-2026 10,817.61 13,583.31 -2,765.70 What are FII and DII in the Stock Market Foreign Institutional Investors (FIIs) invest in the Indian stock market from international markets, while Domestic Institutional Investors (DIIs) include mutual funds and institutional bodies operating from India. fii dii data helps tra
22 July 2026
Made for Traders.
Trusted by Investors.
Download FinX — trade confidently, invest
smarter, track everything.

Table of Contents
- Spinning Top Candlestick Meaning
- Features of a Spinning Top Candle
- Types of Spinning Top Candlesticks Pattern
- Spinning Top Candlestick Pattern - Formation
- How to Identify the Spinning Top Candlestick Pattern?
- Interpreting Market Psychology Through the Spinning Top Candlestick
- Trading Strategies For Spinning Top Candlestick Pattern
- Strategic Approaches to Trading the Spinning Top Candle
- Real-World Example of a Spinning Top Candlestick Pattern
- Benefits of Using the Spinning Top Candlestick Pattern
- Limitations of the Spinning Top Candelstick Pattern
- Managing Risk with Spinning Top Setups
- Incorporate Volume for Added Confirmation:
- Adapt Based on Market Environment:
- Market Environment and Regulatory Landscape in India
- Wrapping Up:
- Frequently Asked Questions (FAQs)