
Understanding price action is critical in technical analysis, and candlestick patterns offer powerful visual cues. Among them, the Marubozu candlestick pattern stands out for its clarity and reliability in signalling strong market sentiment.
This blog explores the essence of Marubozu candles - how to identify and trade them, and what traders should know about managing risks effectively.
Decoding the Marubozu Candle
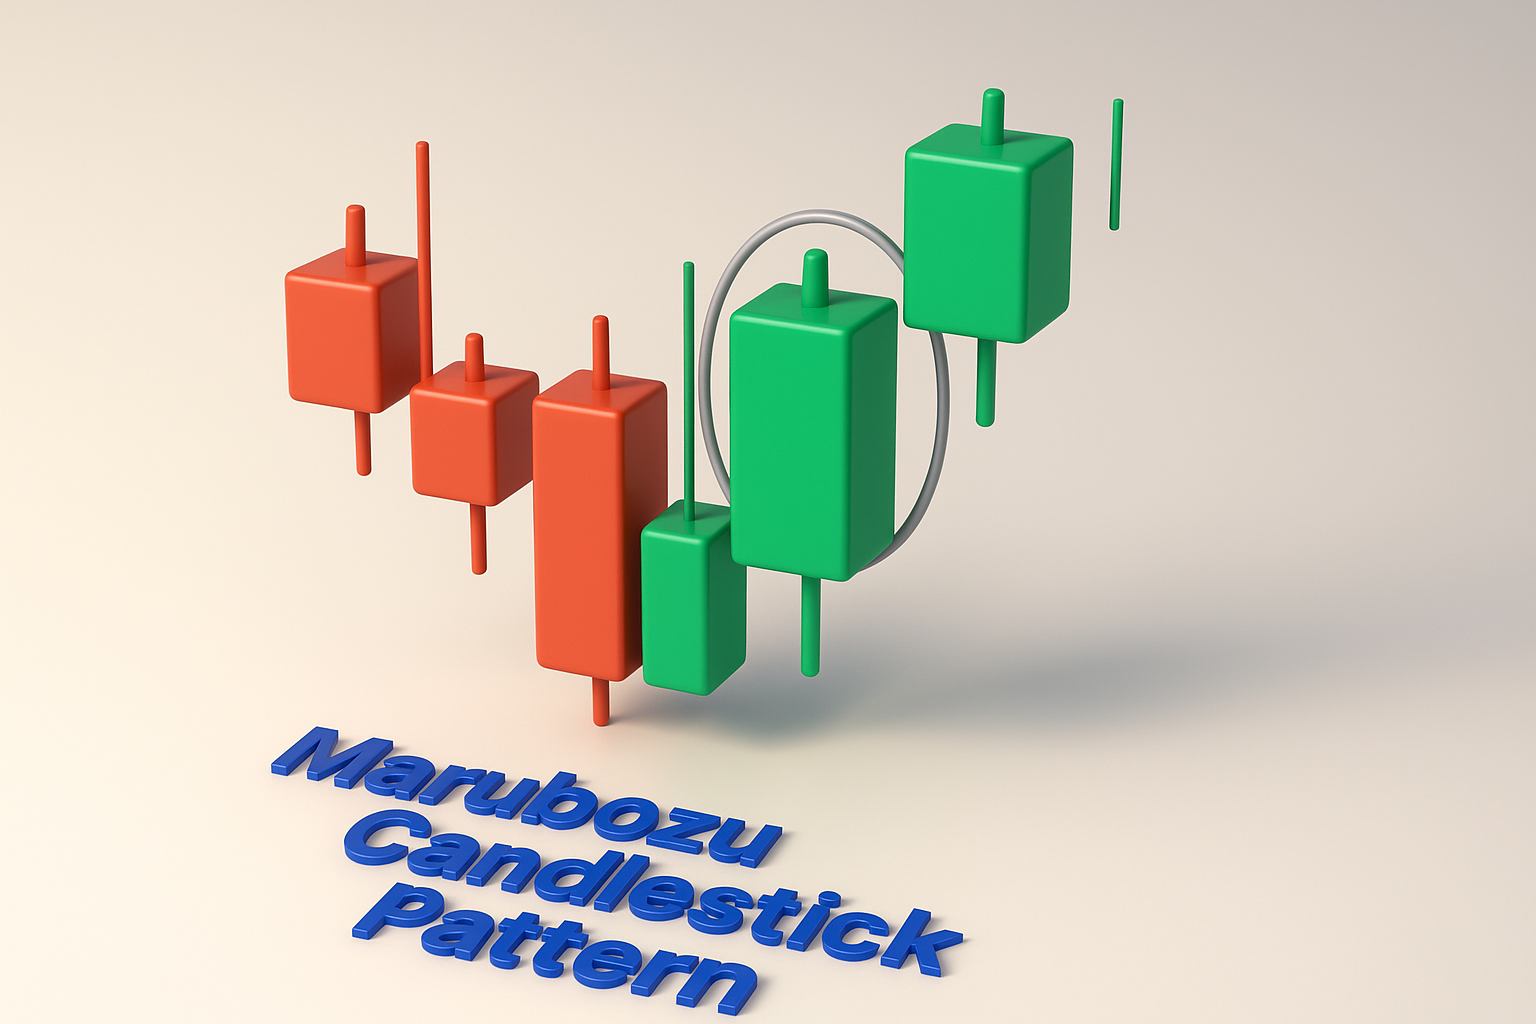
The term "Marubozu" is derived from Japanese, meaning "bald" or "shaved head," reflecting the candle’s distinctive lack of shadows or wicks. A Marubozu candlestick signals strong conviction, either bullish or bearish, and suggests a potential continuation or reversal depending on its position in a trend.
Distinguished by the absence of upper or lower shadows, this type of candlestick begins at its session's high or low and concludes at the opposing end of its range. It visually represents the complete command exercised by buyers (as seen in a bullish Marubozu) or sellers (as seen in a bearish Marubozu) from the start to the finish of trading.
Exploring the Two Faces of Marubozu: Bullish and Bearish
1. Bullish Marubozu (White Marubozu Candlestick Pattern)
- Appearance: Characterised by its lengthy body and absence of upper or lower wicks, this candle is either white or green.
- Implication: Buyers dominated from open to close.
- Trading Context: This pattern signals a robust upward trend, particularly when emerging from a period of sideways movement or at the start of an ascending trend.
Example: Suppose stock XYZ opens at ₹120 and closes at ₹135 without forming any wicks. Buyers' strong control indicates ongoing upward movement, potentially signalling a breakout.
2. Bearish Marubozu (Black Marubozu Candlestick Pattern)
- Appearance: It's a tall, black or red candlestick that lacks any upper or lower shadows.
- Implication: Sellers took full control from start to end.
- Trading Context: Often observed at the beginning of a downtrend or during strong bearish sentiment.
Example: If stock ABC opens at ₹150 and closes at ₹136, with no upper or lower wick, this indicates aggressive selling, suggesting further downside ahead.
Essential Characteristics of a Marubozu Candlestick
Let’s explore the defining features of a marubozu candle to help differentiate it from similar candlestick patterns:
1. No Upper or Lower Shadows:
- The defining characteristic of an authentic Marubozu is the absence of wicks, which implies that the candle's open matches its low (in a bullish scenario) or its high (in a bearish scenario), while its close corresponds to its high (bullish) or its low (bearish).
- This shows uninterrupted control by either bulls or bears throughout the session.
2. Long Candle Body:
- The body of a Marubozu is relatively long compared to recent candles, indicating strong momentum.
- The length reflects the intensity of the buying or selling pressure.
3. Directional Bias:
- A Bullish Marubozu, identifiable by its white or green appearance, begins at the session's lowest price and concludes at its highest.
- Conversely, a Bearish Marubozu (a black or red candle) begins at its peak price and concludes at its lowest point.
4. Appears During Key Market Moves:
- Commonly forms during breakouts, trend initiations, or trend continuations.
- Its effectiveness increases near support/resistance levels or after periods of price consolidation.
5. Context-Dependent Impact:
- The same pattern may signal continuation in a trending market or reversal at key technical levels.
- Marubozu candle types must always be analysed with market context in mind.
6. Enhanced by Volume Confirmation:
- A Marubozu formed with high trading volume indicates stronger conviction and a more reliable signal.
- Low-volume Marubozus might suggest false breakouts or weak follow-through.
Three Key Variants of the Marubozu Candle Pattern
The Marubozu candle types come in three distinct forms, each offering insights into market sentiment and trading momentum.
1. Complete Marubozu (Full Marubozu): This specific pattern embodies the most fundamental characteristic of a Marubozu. The candle has no upper or lower shadows, meaning the price opened at the session’s lowest point and closed at its highest (for bullish), or vice versa (for bearish).
- Interpretation: The trading period was entirely dictated by the continuous influence of either buyers or sellers.
- Strength: Highly reliable for identifying strong momentum.
2. Closing Marubozu (Marubozu Close): In this variation, the candlestick lacks an upper shadow (bullish) or a lower shadow (bearish), but has a small wick at the opening side.
- Bullish version: Slight price movement below the open before surging upward.
- Bearish version: Minor price move above the open before declining.
- Interpretation: While not as forceful as the full Marubozu, it still suggests growing dominance by either buyers or sellers, especially toward the session’s end.
3. Opening Marubozu (Marubozu Open): Characterised by no shadow at its opening, this candle type can still have a short wick near its close.
- Bullish example: Opens at the low and starts rising immediately, with a slight pullback near the close.
- Bearish example: Opens at the high and drops quickly, with a small recovery before the close.
- Interpretation: Indicates strong directional movement right after market open, though slight hesitation may occur near closing.
Why Marubozu Patterns Matter in Trading?
1. Clear Directional Momentum:
The bullish Marubozu candlestick pattern indicates that buyers were in control from the open to the close, with prices climbing steadily. On the other hand, the bearish Marubozu shows a continuous decline, with sellers pushing prices down throughout the session. This absence of price hesitation makes the Marubozu a powerful indicator of market sentiment.
2. Helps Confirm Breakouts and Trend Continuations:
When a Marubozu candle forms after a consolidation phase or near a support/resistance level, it can validate a breakout or the start of a new trend. This makes it a valuable confirmation signal, especially when combined with volume indicators or other technical tools.
3. Signals Potential Reversals in Key Zones:
A white Marubozu candlestick appearing at a critical support level subsequent to a downtrend can be interpreted as a potential bullish turnaround. Conversely, a black Marubozu candlestick pattern at a resistance point may suggest an impending bearish turn. These reversal signals are more trustworthy when the candle appears at a strategic technical level.
4. Useful Across Timeframes:
Whether you're a day trader analysing 5-minute charts or a swing trader looking at daily candlesticks, Marubozu patterns remain relevant. Their simplicity and clarity make them easy to spot across different timeframes and asset classes.
5. Built-In Simplicity for Decision-Making:
Traders value Marubozu candles because of their straightforward interpretation: either the buyers won the entire session (bullish Marubozu) or the sellers did (bearish Marubozu). This clarity facilitates faster decision-making without relying excessively on multiple indicators.
Trading Strategies Using Marubozu Candlesticks
Regardless of whether you're aiming for quick profits or establishing long-term positions, incorporating Marubozu signals into your trading plan can result in more assured and prompt decisions. Here’s how to make the most of them in real-world trading:
1. Validate the Trend’s Strength: Before acting on a Marubozu candle, always analyse its position within the broader trend.
- A bullish Marubozu forming during an existing uptrend usually reinforces continued upward momentum, showing that buyers are firmly in control.
- On the flip side, a bearish Marubozu appearing in a downtrend confirms sustained selling pressure, signalling that bears remain dominant.
This validation aids in preventing misleading indicators and maintaining alignment with the market's trajectory.
2. Use Highs and Lows as Key Price Levels: The extreme points of a Marubozu, its open and close, can act as future support or resistance levels.
- For a bullish Marubozu, its lowest point frequently acts as a dependable support area.
- For a bearish Marubozu, its highest value may function as a level of resistance.
These zones help traders define entry points, stop-loss levels, and profit targets, making your trading plan more structured and risk-aware.
3. Watch for Potential Reversal Setups: While Marubozus often confirm trend continuation, they can also hint at possible reversals when they appear at key price extremes.
- A bearish Marubozu candlestick pattern showing up after a prolonged rally may suggest weakening bullish sentiment and a potential shift downward.
- When a bullish Marubozu candlestick forms after a downtrend, it might signal a change in market momentum and the beginning of an upward movement.
Use these cues to prepare for strategy adjustments, especially around major support/resistance levels or trendlines.
4. Confirm with Trading Volume: Volume is a critical element when assessing the reliability of a Marubozu signal.
- A Marubozu formed on above-average volume is typically more trustworthy, as it reflects strong institutional or broad-based participation.
- Low-volume Marubozus may indicate weaker conviction and should be approached with caution.
Combining Marubozu candlesticks with volume analysis increases the probability of successful trades and filters out potential false signals.
Pros and Cons of Trading Marubozu Patterns
| Advantages | Disadvantages |
|---|---|
| Clear Trend Signals: Marubozu patterns indicate strong buying or selling momentum, making them easy to interpret for traders. | Lack of Confirmation Alone: Relying solely on Marubozu without supporting indicators (like volume or trend analysis) can lead to false entries. |
| Helpful in Identifying Entry Points: The open and close prices often act as key levels for setting entries, stop-losses, or profit targets. | Less Effective in Ranging Markets: Marubozu patterns work best in trending markets and may provide misleading signals during sideways movement. |
| Applicable Across Timeframes: These patterns can be used in intraday, swing, or long-term trading strategies. | May Appear Without Volume Support: A Marubozu formed on low volume may not represent genuine market sentiment. |
| Assists in Spotting Breakouts and Reversals: Particularly effective near support and resistance levels to confirm trend shifts or continuations. | Not Always Followed by Continuation: Sometimes, price retraces after a strong Marubozu candle, leading to potential losses if not managed properly. |
| Visually Simple and Easy to Identify: The absence of shadows makes them stand out on charts, reducing complexity for new traders. | Overuse Can Reduce Accuracy: Frequent appearances or near-Marubozu candles may desensitise traders to true signals, lowering effectiveness. |
Trader Psychology: Risk-Takers vs. Risk-Averse with Marubozu
When it comes to trading using the Marubozu candlestick pattern, investor psychology plays a major role in decision-making, particularly when comparing risk-takers to risk-averse traders.
The Risk-Taker's Approach:
Aggressive traders are often comfortable initiating positions as soon as a Marubozu candle appears, especially if it forms near the market’s close. For example, a bullish Marubozu (commonly shown as a blue or green candle) might prompt them to buy immediately, anticipating continued momentum. However, this strategy carries a downside: if the following day opens with a bearish candle (often red), the trade could quickly turn unprofitable.
The Risk-Averse Strategy:
Conversely, cautious traders typically await trend confirmation prior to taking action. Instead of entering a trade on the same day the Marubozu forms, they prefer to see how the market behaves the next day. If the following session also reflects bullish sentiment, they may then decide to enter.
- Benefit: Greater confidence in trend direction.
- Trade-off: A higher entry price and a larger stop-loss, since the ideal buy point may have already passed.
This method focuses on reducing risk by ensuring that the market's strength isn’t just a one-day anomaly, but part of a continued movement.
Balancing Opportunity and Caution:
Both approaches have their place. Risk-takers may capture early momentum but face higher volatility, while risk-averse traders trade with more assurance but often at the cost of reduced profit margins. The key is aligning the strategy with one's risk appetite and trading goals, while using tools like volume analysis, support/resistance zones, and broader market trends to strengthen decisions.
Smart Risk Management with Marubozu Signals
Here's how to approach smart risk management when trading with bullish or bearish Marubozu candles.
1. Always Use a Stop-Loss Based on Candle Extremes:
The open and close prices of a Marubozu candle are ideal benchmarks for setting your stop-loss:
- For a bullish Marubozu candlestick, position your stop-loss order directly beneath the candle's low (which is its opening price).
- Conversely, with a bearish Marubozu, its high (the opening price) serves as a logical stop-loss level.
This method ensures that your trade remains valid only if the initial sentiment continues in your favour.
2. Manage Position Size Based on Candle Length:
Since Marubozu candles tend to have long bodies, they may introduce a larger risk per trade if stop-losses are placed too wide.
To mitigate this:
- Tailor your position size so that the risk taken on each trade remains constant (for instance, limiting exposure to just 1% to 2% of your overall capital).
- The larger the Marubozu candle, the smaller your position size should be.
3. Combine with Technical Confirmation Tools:
To filter false signals:
- Validate substantial market involvement in the price movement by confirming with trading volume.
- Look for confluence with trendlines, moving averages, or support/resistance zones before entering a trade.
This multi-layered confirmation minimises the chances of reacting to an isolated price event.
4. Avoid Chasing the Candle:
Entering late after a Marubozu form can often lead to poor risk-reward ratios. If you missed the initial move:
- Wait for a pullback or retracement to re-enter at a more favourable level.
- Consider using Fibonacci retracement tools or former resistance levels that have become support as new entry points.
5. Know When to Exit:
Smart risk management also means knowing when to walk away:
- Establish achievable objectives by utilising proximate resistance or support levels, or by calculating measured movements.
- To safeguard earnings as the trend develops, implement a trailing stop-loss.
Key Takeaway
A Marubozu candle may show a dominant move, but risk control is what protects capital in volatile markets. By combining the Marubozu signal with structured stop-losses, thoughtful sizing, and technical confirmations, traders can maximise gains while minimising exposure, a critical balance for long-term trading success.
Final Thoughts
The Marubozu candlestick pattern reliably indicates strong underlying market sentiment. While not foolproof, it can significantly enhance a trader’s ability to interpret momentum and execute well-timed trades. Like any strategy, it works best when paired with risk management and broader market context analysis.
Master the pattern, use it wisely, and it can be a valuable ally in your trading journey.
FAQs (Frequently Asked Questions)
What does a Marubozu candlestick indicate?
A Marubozu candle signals strong buyer (bullish) or seller (bearish) dominance during the session, reflecting decisive market sentiment.
Can a Marubozu appear on any timeframe?
Yes, but the higher the timeframe (like daily or weekly), the more reliable the pattern becomes due to reduced noise.
Can one safely conduct trades by only considering a Marubozu candlestick pattern?
No. While strong, it should be used with other indicators and within the context of trend analysis and support/resistance zones.
Can you explain the variations between white and black Marubozu patterns?
A white Marubozu candlestick is bullish, indicating strong buying, while a black Marubozu candlestick pattern shows strong selling and bearish momentum.
How do traders confirm a Marubozu signal?
Confirmation typically comes from high trading volume, continuation in the same direction with the next candle, or support from other technical indicators.
Also read:
Triple Top Pattern Explained: How to Spot and Trade Market Reversals |
Shooting Star Candlestick Pattern |
What is the Hammer Candlestick Pattern? Step-by-Step Guide For Investors |
Inverted Hammer Candlestick Pattern |
Related Blog

FII DII Data Today 24th July 2026 CATEGORY DATE BUY VALUE (₹ Crores) SELL VALUE (₹ Crores) NET VALUE (₹ Crores) DII 24-July-2026 17,254.44 11,665.16 5,589.28 FII 24-July-2026 10,470.69 14,494.75 -4,024.06 What are FII and DII in the Stock Market Foreign Institutional Investors (FIIs) invest in the Indian stock market from international markets, while Domestic Institutional Investors (DIIs) include mutual funds and institutional bodies operating from India. fii dii data helps tra
23 July 2026

Nifty Prediction For Tomorrow The Nifty 50 tomorrow market prediction indicates a Sideways to Bullish trend. The range is between 23500 and 24000, with support at 23500-23550 and resistance at 23950-24000. Traders should monitor these crucial levels closely for potential market shifts. Nifty 50 Share Price * Nifty Support: 23500-23550 * Nifty Resistance: 23950-24000 * BIAS: Sideways to Bearish Nifty Range 23500 24000 Indian equity benchmark Nifty ended the session on a weak no
23 July 2026

Nifty Prediction Today Today, Nifty 50 prediction suggests a Sideways to Bullish range between 23500 and 24000, with strong support at 23500-23550 and resistance at 23950-24000 Traders should monitor these crucial levels closely for potential market shifts. Nifty Support and Resistance Level Today * Nifty Support: 23500-23550 * Nifty Resistance: 23950-24000 * BIAS: Sideways Nifty Range 23500 24000 Indian equity benchmark Nifty ended the session on a weak note, settling at 23,86
23 July 2026
Made for Traders.
Trusted by Investors.
Download FinX — trade confidently, invest
smarter, track everything.

Table of Contents
- Decoding the Marubozu Candle
- Exploring the Two Faces of Marubozu: Bullish and Bearish
- Essential Characteristics of a Marubozu Candlestick
- Three Key Variants of the Marubozu Candle Pattern
- Why Marubozu Patterns Matter in Trading?
- Trading Strategies Using Marubozu Candlesticks
- Pros and Cons of Trading Marubozu Patterns
- Trader Psychology: Risk-Takers vs. Risk-Averse with Marubozu
- Balancing Opportunity and Caution:
- Smart Risk Management with Marubozu Signals
- Key Takeaway
- Final Thoughts
- FAQs (Frequently Asked Questions)
- Also read: