
Traders often rely on candlestick patterns as effective visual tools to interpret price action and anticipate possible trend reversals in the market. Among these patterns, the hammer candlestick pattern stands out for signalling bullish reversals after a downtrend.
Whether you're new to trading or have years of experience, this article will guide you in identifying and effectively trading the bullish hammer candlestick. So you can make more informed decisions during volatile market conditions.
Hammer Candlestick Pattern - Definition & Meaning
A hammer candlestick is a one-candle bullish reversal pattern that often appears after a downtrend, indicating a possible shift in momentum to the upside. It showcases a small, compact body situated near the candle’s top, along with the lower wick, usually double the size of the body’s length, and either a minimal or absent wick. This pattern reveals that even though sellers initially pushed prices lower during the trading session, buyers ultimately intervened, successfully raising the price by the close.
This formation occurs when sellers initially drive the price down during a trading session, but strong buying pressure pushes the price back up near the opening level. The candle's appearance resembles a hammer, representing the market's attempt to form a bottom and signal a possible reversal of the downward trend.
The bullish hammer candlestick is especially significant when it appears after a prolonged downtrend, indicating that buyers are stepping in and that bearish momentum may be weakening.
Why the Hammer Pattern Matters in Technical Analysis?
The hammer candlestick pattern is highly valued in technical analysis because it offers early clues about a potential bullish reversal after a downtrend.
Let’s understand why the bullish hammer candlestick pattern is significant in the Indian stock market:
- Signals a Possible Trend Reversal: It helps traders identify when a downtrend may be losing steam, and a new uptrend could be forming.
- Improves Entry Timing: Spotting a bullish hammer pattern at key support levels can allow traders to enter long positions early, before the broader market confirms the reversal.
- Enhances Risk Management: When used correctly, it provides clear levels for placing stop-loss orders, typically just below the hammer's low, thus limiting potential losses.
- Works Across Markets: The pattern is effective in stocks, forex, commodities, and even cryptocurrencies, making it a versatile tool in any trader’s strategy.
- Simple and Visual: The hammer candlestick is simple for visualising, making it easier to spot on a chart. This accessibility benefits both new and experienced traders, unlike more complex indicators.
Recognising the Hammer Candlestick: Key Traits
Recognising a hammer candlestick pattern on a chart is straightforward if you know what to look for. Let’s take a look at some of the key features of the hammer candlestick for a better understanding:
- Small Real Body: The candle has a compact body located near the top of the price range. The colour (green or red) is less important than its position, though a green body may suggest stronger bullish intent.
- Long Lower Shadow: The length of the lower wick should measure at least twice that of the candlestick's body. This showcases that although sellers drove prices down considerably during the session, buyers intervened and pushed prices back up by the close.
- Little to No Upper Shadow: A true hammer has almost no upper wick, reinforcing the idea that bulls took control by the close of the session.
- Appears After a Downtrend: Context is key. A hammer pattern is meaningful only when it shows up after a period of declining prices, signalling a potential shift in momentum.
Various Types of Hammer Candlesticks
There are two primary types of hammer candlestick patterns, each offering insights into potential market reversals, especially after a downtrend:
1) Bullish Hammer Candlestick:
The bullish hammer candlestick pattern typically appears at the end of a downtrend and is identified by a small real body positioned near the top, along with a long lower shadow. It indicates significant buying interest, although sellers initially dragged the price down, buyers regained control and pushed the price back toward the opening level. This setup is a well-known signal of a potential bullish reversal, particularly when supported by increased trading volume or a strong upward candle that follows.
2) Inverted Hammer Candlestick:
An inverted hammer candlestick appears after a downtrend and is characterised by a small real body positioned near the lower end of the candle, along with a long upper shadow. This pattern shows that buyers attempted to push prices higher during the session, but sellers applied pressure, causing the price to retreat before the close. Although not as strong as the traditional hammer, the inverted hammer still hints at a possible bullish reversal, especially if the next candle confirms the move with a solid upward close.
How to Interpret Hammer Candlestick Patterns?
When traders spot a hammer candlestick after a downtrend, it often suggests that the price may be ready to reverse and start moving upward.
Here’s what the pattern tells us: during the trading session, the price opened, dropped sharply, but then recovered and closed near or above the opening level. This shows that buyers stepped in and pushed the price up after strong selling earlier in the session. The extended lower shadow illustrates the intraday price decline, while the compact body near the top reflects the market's recovery by the session’s end.
The hammer becomes more meaningful if it appears after several red (Bearish) candles in a row. To strengthen the signal, traders often wait for the next candle to close above the high of the hammer, as this follow-through indicates a shift in momentum favouring the buyers.
The majority of traders prefer to see this confirmation before making a trading decision. Also, it’s important not to rely on the hammer pattern alone, it should be used with other tools like support/resistance levels or volume indicators to make better trading decisions.
Example of a Bullish Hammer Candlestick
Imagine a stock, ABC Ltd., has been declining for several consecutive sessions. On Tuesday, it opens at ₹150, drops significantly to ₹138 during the day, but later rebounds and closes near its opening price at ₹149.
This results in a candlestick that appears as follows:
- Open: ₹150
- Low: ₹138
- Close: ₹149
- High: ₹151
This forms a classic bullish hammer candlestick:
- The real body of the candle is small and located near the top (opening at ₹150 and closing at ₹149)
- There’s a long lower shadow (from ₹149 down to ₹138).
- The upper wick is small (₹151 high).
This pattern tells traders that although sellers were in control early in the day, buyers came in strongly and pushed the price back up by the close. If the next day's candle closes above ₹149, it confirms the reversal signal, and many traders might consider entering a long position, expecting a potential uptrend.
This kind of price action reflects a possible shift in momentum from bearish to bullish and is a textbook example of how a bullish hammer pattern can appear in real markets.
Trading the Hammer Candlestick: Your Step-by-Step Guide
1. Identify the Hammer After a Downtrend:
Watch for the formation of a bullish hammer candlestick pattern that appears following a well-defined downward trend.
The hammer should have:
- A small body is positioned near the upper part of the candle.
- A long lower wick (at least twice the length of the body).
- Little or no upper wick.
2. Wait for Confirmation:
Avoid entering a trade right after spotting a hammer. Instead, wait for the following candle to close above the high of the hammer, which signals that buying pressure is continuing.
3. Set Your Entry Point:
Place your buy order slightly above the high of the confirmation candle. This ensures you're entering with momentum on your side.
4. Place a Stop-Loss Order:
To limit potential losses, set a stop-loss just below the hammer’s low. This helps safeguard your position if the market reverses unexpectedly.
5. Set a Profit Target or Use a Trailing Stop:
Establish a clear profit target using nearby resistance levels, or apply a trailing stop-loss to secure profits as the trade moves in your favour.
6. Combine with Other Tools:
For greater reliability, use the hammer pattern alongside other tools such as:
- Support and resistance levels
- Volume analysis
- Moving averages
- RSI or MACD for confirmation
Avoid These Common Pitfalls When Trading the Hammer Pattern
Even though the hammer candlestick pattern is a popular and powerful tool for identifying bullish reversals, many traders misuse it, often leading to poor decisions and losses. Below are several frequent errors traders should steer clear of:
1. Ignoring the Trend Context: A hammer is only effective after a clear downtrend. If you spot a hammer during sideways movement or an uptrend, it may not indicate anything significant. Always analyse the broader trend before acting.
2. Entering Without Confirmation: Jumping into a trade immediately after a hammer forms is risky. Always wait for a bullish confirmation candle, one that closes above the hammer’s high, before entering a long position.
3. Neglecting Volume Analysis: Low volume during the hammer formation could mean weak buyer interest. Increased trading volume strengthens the reliability of the reversal signal. Without it, the pattern could be a false alert.
4. Setting Stop-Loss Too Tight: Placing your stop-loss too close to the hammer’s body (instead of below the wick) increases the chance of being prematurely stopped out. Always give the trade enough room to develop.
5. Relying on the Hammer Alone: The hammer should not be used in isolation. Failing to use other tools like support/resistance levels, momentum indicators (like RSI), or moving averages can lead to poor-quality setups and lower success rates.
6. Forgetting to Check Multiple Timeframes: A hammer on a 5-minute chart may not mean much if the higher timeframes don’t support a reversal. Before trading on a signal, always verify alignment with larger timeframes.
Final Thoughts
The hammer candlestick is a powerful pattern that highlights potential bullish reversals. It is most effective when used in combination with other technical indicators and a solid understanding of market context. By applying the right strategy and avoiding common mistakes, traders can enhance their entry timing and improve trade outcomes.
Frequently Asked Questions (FAQs)
Is the bullish hammer candlestick reliable for all stocks?
Not always. While the bullish hammer pattern is a strong signal, its effectiveness varies with volume, trend strength, and market conditions.
Can I use the hammer candlestick pattern effectively for intraday trading?
Yes, but it works better on higher timeframes like daily or hourly charts. In intraday charts, false signals are more common.
What distinguishes the hammer candlestick pattern from a Doji?
A hammer has a small body with a long lower wick, while a Doji has nearly no body, indicating indecision rather than a reversal.
Which time frame is most effective for identifying the hammer candlestick pattern?
Daily and weekly timeframes offer more reliable hammer patterns compared to shorter ones like 5-minute or 15-minute charts.
Is the hammer pattern effective in crypto trading?
Yes, the hammer candlestick pattern can be applied across markets, including stocks, forex, and cryptocurrencies. Simply make sure that the trading volume and overall trend context align with the pattern’s signal.
| Also Read |
|---|
| Shooting Star Candlestick Pattern |
| Triple Top Pattern |
Related Blog
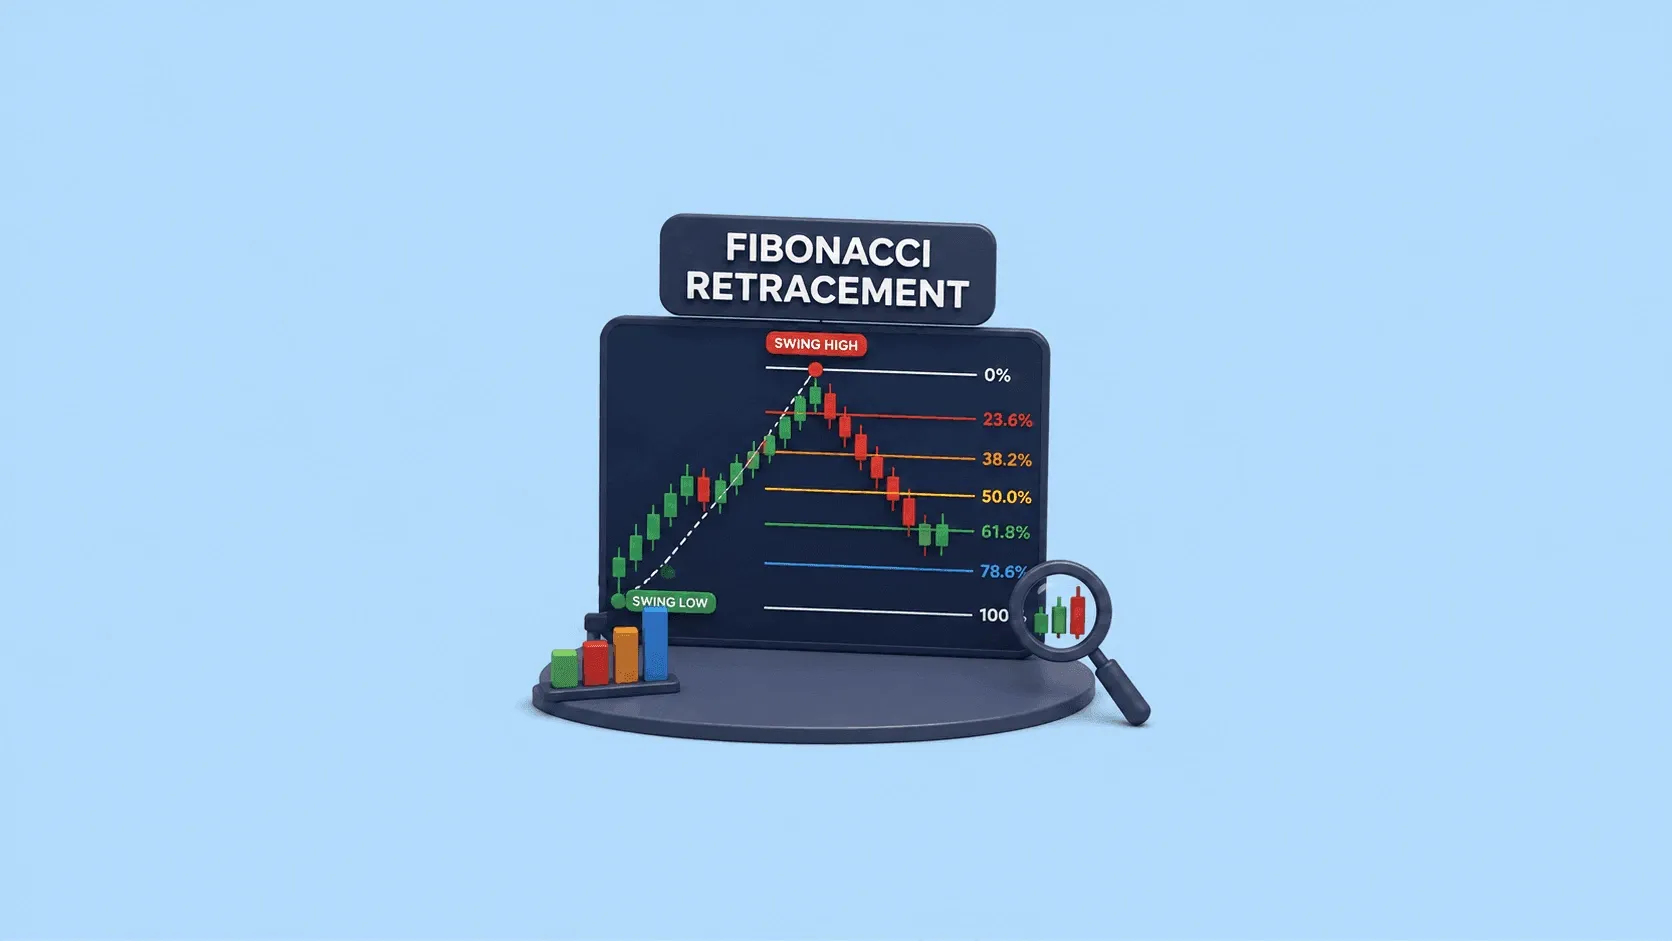
If you are a trader, you may have used technical analysis to analyse price movements and identify potential trading opportunities. While reading about technical analysis, you might have heard of the term “Fibonacci retracement”. But what exactly is it and how is it used? In this blog, we will learn about Fibonacci retracement and understand what the tool does, how it is calculated and how you can use it on a chart. What is Fibonacci Retracement (Fib)? Fibonacci Retracement is a technical ana
23 July 2026

If you’re an investor, you have likely noticed that the market selmdo moves` in a straight line. It rises, falls, consolidates, and then rises again. This repeating pattern isn’t random; it follows recurring patterns, although their duration and intensity vary from one cycle to another. This is known as the market cycle. Understanding this pattern may not always guarantee a profit, but it helps investors and traders to understand the market, rather than reacting emotionally to every news headli
23 July 2026

FII DII Data Today 23rd July 2026 CATEGORY DATE BUY VALUE (₹ Crores) SELL VALUE (₹ Crores) NET VALUE (₹ Crores) DII 23-July-2026 14,716.79 12,008.69 2,708.10 FII 23-July-2026 10,817.61 13,583.31 -2,765.70 What are FII and DII in the Stock Market Foreign Institutional Investors (FIIs) invest in the Indian stock market from international markets, while Domestic Institutional Investors (DIIs) include mutual funds and institutional bodies operating from India. fii dii data helps tra
22 July 2026
Made for Traders.
Trusted by Investors.
Download FinX — trade confidently, invest
smarter, track everything.

Table of Contents
- Hammer Candlestick Pattern - Definition & Meaning
- Why the Hammer Pattern Matters in Technical Analysis?
- Recognising the Hammer Candlestick: Key Traits
- Various Types of Hammer Candlesticks
- How to Interpret Hammer Candlestick Patterns?
- Trading the Hammer Candlestick: Your Step-by-Step Guide
- Avoid These Common Pitfalls When Trading the Hammer Pattern
- Final Thoughts
- Frequently Asked Questions (FAQs)