
Tracking the performance of an investment over time can be confusing, especially when returns fluctuate year to year. That’s where Compound Annual Growth Rate (CAGR) comes into play.
Whether you're investing in mutual funds, stocks, or businesses, understanding CAGR helps you make smarter financial decisions by offering a clear view of long-term growth. This guide covers the CAGR's meaning, calculation, uses, and key advantages.
What is CAGR?
CAGR's full form is Compound Annual Growth Rate. It indicates the yearly average rate at which an investment increases over a period exceeding one year, based on the assumption that the growth occurs at a consistent pace throughout.
In simple terms, CAGR tells you the fixed annual rate at which your investment would have increased if it had grown steadily over the entire investment period. It smoothens out the volatility and gives a clearer picture of long-term growth.
The Working Principle Behind CAGR
CAGR is intended to reflect a consistent annual return by assuming that any earnings are reinvested at the end of each year, resulting in a smoothed average growth rate over time. It doesn’t reflect the actual yearly return; instead, it gives you a standardised metric to compare different investments fairly.
Imagine investing in a stock whose value changes dramatically year-to-year. CAGR helps normalise these fluctuations, making performance analysis simpler and more reliable.
How To Calculate CAGR: Step-by-Step with Example
The CAGR calculation formula is as follows:
CAGR = (Ending Value / Beginning Value) ^ (1 / Number of Years) – 1
Step-by-Step Calculation:
Suppose you invested ₹1,00,000 in a mutual fund, and its value grew to ₹1,76,000 in 4 years. Here's how to calculate CAGR:
- Beginning Value = ₹1,00,000
- Ending Value = ₹1,76,000
- Time Period = 4 years
CAGR = (176000 / 100000) ^ (1/4) – 1
CAGR = (1.76) ^ 0.25 – 1
CAGR = 1.151 – 1
CAGR = 0.151 or 15.1%
Over the specified timeframe, the investment demonstrated a 15.1% compounded annual growth rate.
If you want to save time and avoid manual calculations, you can use Choice’s online CAGR calculator.
Also read: CAGR VS XIRR
CAGR in the Stock Market: What You Need to Know
Wondering what is CAGR in the stock market? It refers to the annual growth rate of a stock or equity investment over time, adjusted for volatility. Investors often use CAGR to assess the performance of individual stocks or portfolios.
For instance, if you bought shares of a company five years ago and want to measure how much it has grown annually, CAGR gives a more accurate picture than merely observing the price variation over time.
Key Applications of CAGR
Compound Annual Growth Rate (CAGR) is a versatile tool used across various financial and business scenarios. Here are some of the key practical uses for CAGR:
1. Evaluating Investment Performance:
CAGR is widely used to assess the performance of investments such as stocks, mutual funds, ETFs, and bonds over time. It provides a smoothed-out annual growth rate, helping investors understand how effectively their money has grown.
2. Comparing Different Investment Options:
Since CAGR standardises the growth rate, it becomes easier to compare multiple investment products with different timeframes or volatility. This helps investors choose the most suitable option based on consistent long-term returns.
3. Measuring Business Growth:
Businesses use CAGR to analyse growth in revenue, profits, or customer base over a period of time. It helps in strategic planning and in evaluating company performance in a quantifiable way.
4. Forecasting Future Growth:
CAGR is useful in projecting future values based on historical performance. While it doesn’t predict actual future returns, it offers a base for estimating future outcomes under stable growth conditions.
5. Analysing Market Trends:
Analysts and financial planners use CAGR to study broader market or industry trends over a specific period. It helps compare how various sectors have performed and identifies potential areas of growth.
Pros and Cons of Using CAGR
Compound Annual Growth Rate (CAGR) is a powerful tool for evaluating investment growth, but like any metric, it has its strengths and limitations.
Below is a detailed look at the main benefits and limitations associated with using CAGR:
Advantages of CAGR | Limitations of CAGR |
Smooths out fluctuations to reveal average annual growth. | Does not account for the ups and downs during the investment period. |
Simplifies comparing various investments across different timeframes. | Misses major events like market crashes or rallies. |
Straightforward formula and interpretation. | It may give a skewed view over short durations. |
Applicable in mutual funds, stocks, business growth, etc. | It can give a false impression if unusual values affect the results. |
Final Thoughts
CAGR is a vital financial metric that brings clarity and precision to your investment analysis. While it may not capture every market movement, its ability to represent consistent annual growth makes it invaluable for long-term planning.
By understanding how to calculate CAGR and applying it wisely, you can better assess the true potential of your investments, be it in the stock market or mutual funds.
Also read: XIRR in Mutual Funds
Frequently Asked Questions (FAQs)
What is the CAGR full form in mutual fund investments?
CAGR stands for Compound Annual Growth Rate, and in mutual funds, it represents the average yearly return over a specific period, factoring in compound interest.
How to calculate CAGR using a formula?
Use the formula: CAGR = (Ending Value / Beginning Value)^(1/Years) – 1. Insert your investment's initial and final values and the number of years held to find the average annual return.
Is CAGR better than absolute returns?
Yes, for long-term analysis. CAGR shows average annual growth and adjusts for compounding, while absolute returns only reflect total gain or loss without context.
Can CAGR be negative?
Yes. If an investment's final value is lower than its starting value, the CAGR becomes negative, indicating an annual loss or decline.
Related Blog
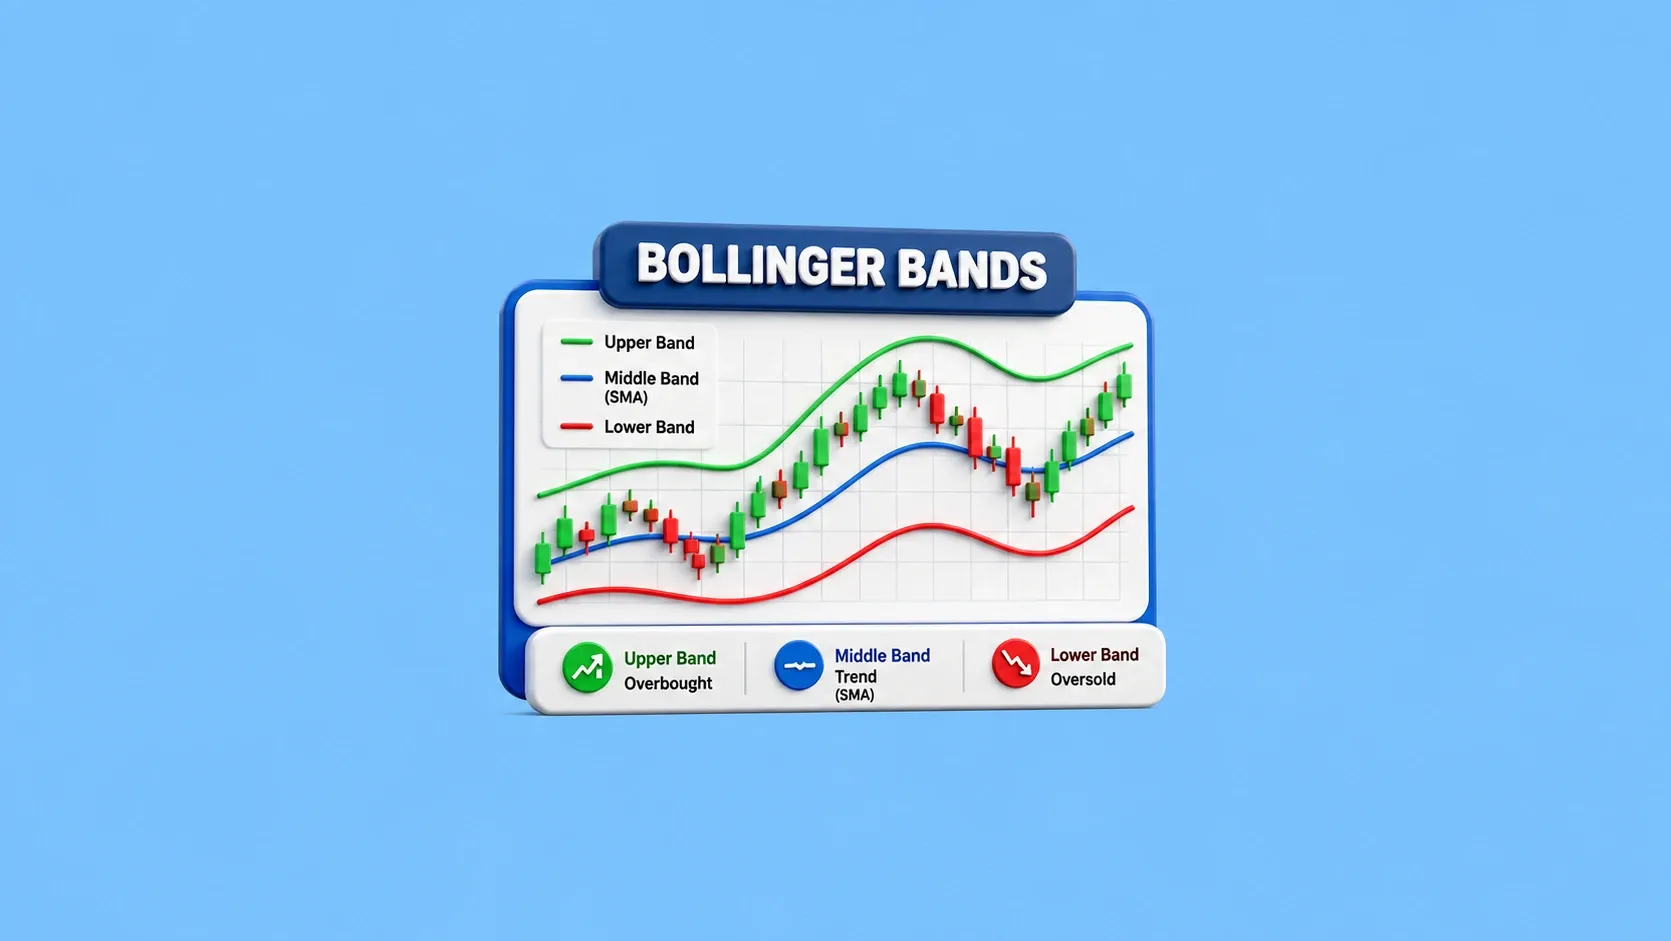
The Bollinger Bands indicator is a popular technical analysis tool that helps traders measure market volatility and identify potential trading opportunities. Whether you're trading Stocks, Nifty, or derivatives, understanding what Bollinger Bands are can help you analyse price movements more effectively. In this guide, you’ll learn how Bollinger Bands work, how they are calculated, popular trading strategies, and how to apply them using Choice FinX. What are Bollinger Bands? The Bollinger Ba
27 July 2026

FII DII Data Today 27th July 2026 CATEGORY DATE BUY VALUE (₹ Crores) SELL VALUE (₹ Crores) NET VALUE (₹ Crores) DII 27-July-2026 14,423.91 12,137.80 2,286.11 FII 27-July-2026 11,440.52 13,113.48 -1,672.96 What are FII and DII in the Stock Market Foreign Institutional Investors (FIIs) invest in the Indian stock market from international markets, while Domestic Institutional Investors (DIIs) include mutual funds and institutional bodies operating from India. fii dii data helps tra
26 July 2026

Nifty Prediction For Tomorrow The Nifty 50 tomorrow market prediction indicates a Sideways to Bullish trend. The range is between 23800 and 24250, with support at 23800-23850 and resistance at 24200-24250. Traders should monitor these crucial levels closely for potential market shifts. Nifty 50 Share Price * Nifty Support: 23800-23850 * Nifty Resistance: 24200-24250 * BIAS: Sideways to Bullish Nifty Range 23800 24250 Indian equity benchmark Nifty 50 staged a strong recovery, e
26 July 2026
Made for Traders.
Trusted by Investors.
Download FinX — trade confidently, invest
smarter, track everything.
