
Have you ever felt stuck in the complexities of intraday trading and wondered when to enter or exit? Don’t worry because a lot of traders often face this dilemma. To solve this problem, technical analysis for intraday trading works as a saviour.
But what is technical analysis, why is it important, and how can you do it?
Technical analysis is the study of market trends, price, volume, and other factors in order to generate calculated trading signals in order to buy the best stocks especially for short term trading.
It plays an essential role in intraday trading because the intraday trading time is a very narrow window, and a trader needs to make the most out of it. Technical analysis studies the sentiments of the market and then work accordingly.
How to Do Technical Analysis For Intraday Trading
Now the technical analysis is the study of market trends, price, volume, and other factors in order to generate calculated trading signals.
If you want to pick the right stocks for intraday trading, you can do the technical analysis in the following ways.
Reading The Charts
Once you have shortlisted the stocks based on various factors, you can confirm the same by looking at the chart. You can use the 5 minutes, 10 minutes, and 15-minute charts for a better idea of the movement of the stocks.
There are various chart types as well that you can use to get better signals. In the case of an intraday trading chart, you can make use of line charts. Line charts help in understanding the overall trend of the market.
The line chart tracks the stock’s closing prices over time and therefore helps an intraday trader read the general market trend and then work accordingly.
Just in case you want to observe the market a little closer and confirm the findings of the line chart, you can use the candlestick charts as well. A candlestick chart tells the stocks’ open, close, high, and low and gives a better idea to the intraday trader.
There are various candlestick patterns as well that can essentially help an intraday trader in making a lot of decisions. Let us have a look at some of these patterns.
Candlesticks Patterns
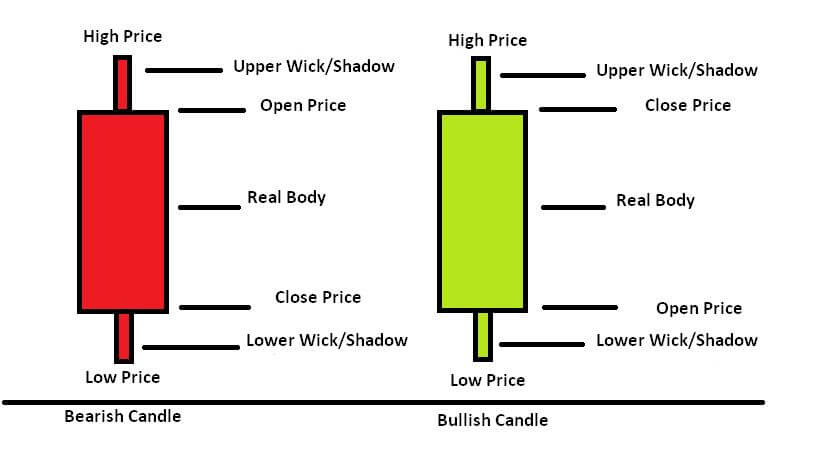
Candlestick chart is the most commonly used chart type in trading. The candlesticks visually represent how much the price of a particular stock has moved over a given period of time. A candlestick is composed of a body and 2 wicks on both sides.
The body represents the difference between the opening and closing price. The wicks, on the other hand, represent the high and low points of the stock price.
As discussed above that, there are various bullish and bearish patterns formed by the candlestick to guide the traders in making profitable decisions.
Hammer Pattern
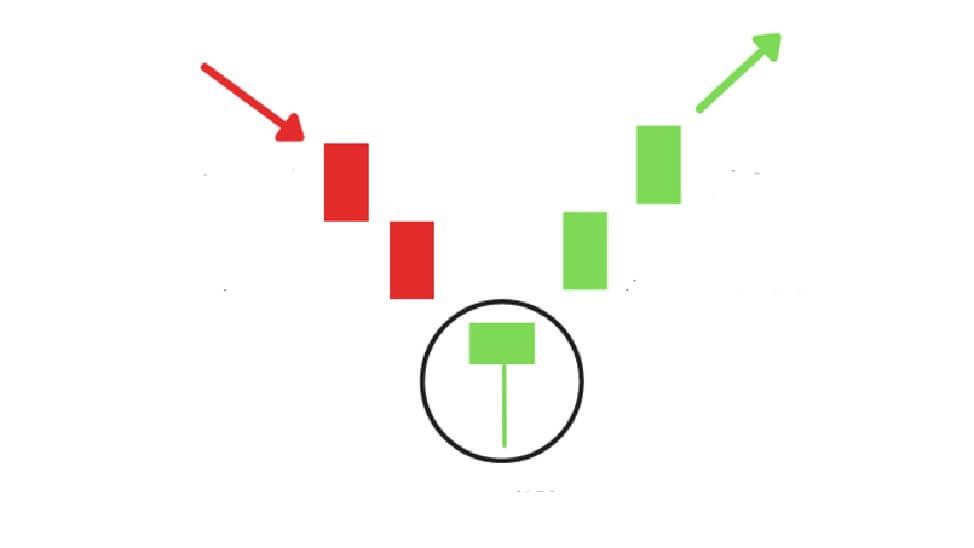
The Hammer pattern is a bullish candlestick pattern. In this, the body of the candlestick is small, and the lower wick is comparatively long.
If there is an ongoing downtrend and at the bottom of this trend, there is a hammer, then there are chances that the stock prices will potentially increase and see a bullish run.
If the hammer candlestick is a green candle, then the signal is stronger when compared to a red hammer candlestick.
The hammer pattern after a downtrend signifies that even though there are a lot of sellers in the market, the buyers are ready to take charge. This can be a good opportunity for an intraday trader to enter a stock.
Hanging Man Pattern

Just like the hammer pattern, the hanging man pattern also has a shorter body and a longer lower wick. So then what is the difference?
The hanging man pattern is a bearish candlestick pattern and is present at the top of a bullish trend.
The pattern indicates that the bull run is not coming to a halt, and the sellers will soon gain control of the market.
This is the right time for traders who want to take short positions or wish to exit an existing position.
Bullish Engulfing Pattern
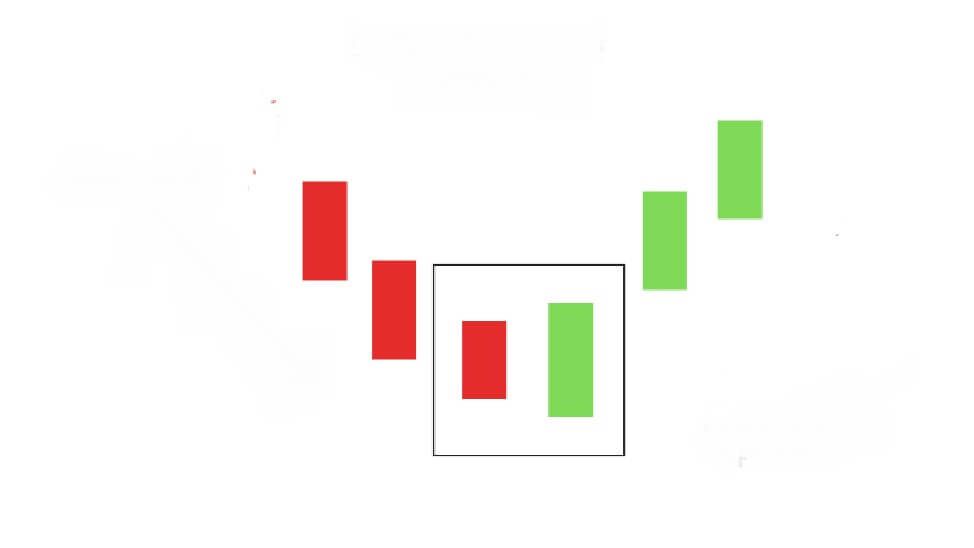
This bullish candlestick pattern comprises two candlesticks. Thus, if a smaller red candle is covered or engulfed by a larger green candle, then it is a bullish engulfing pattern.
The pattern indicates that even though the stock opened at a lower price on the previous day, the bullish trend is more vital today.
If a trader spots this kind of candlestick pattern, he can definitely think of taking a long position in the particular stock.
Bearish Engulfing Pattern
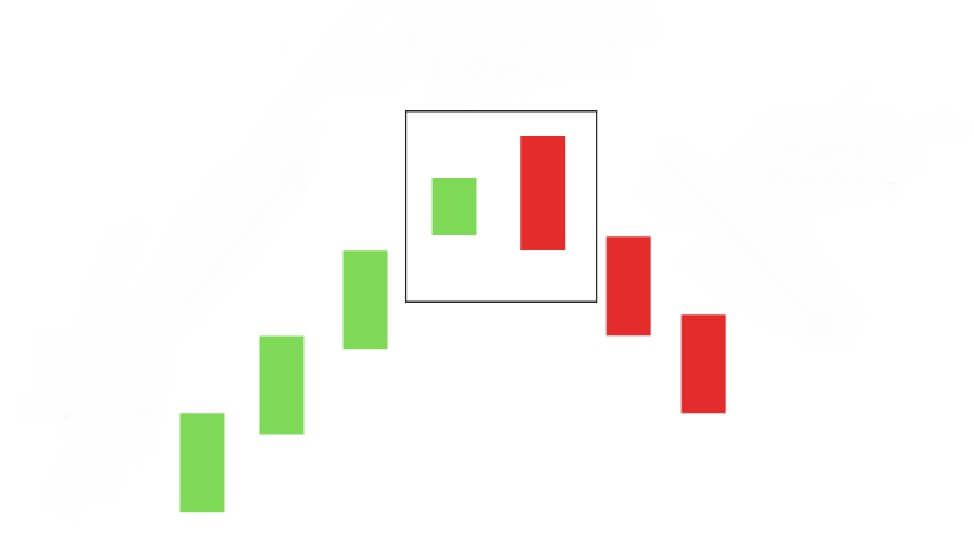
Just like the bullish engulfing pattern, there is a bearish engulfing pattern as well. This pattern indicates that the market will soon be dominated by the sellers and gives the traders an opportunity to exit their positions with significant profits.
This also gives the traders a chance to take short positions. But what happens in this pattern?
In this, a green candle that is on the top of a bullish trend is engulfed by a red candle. If the red candle is lower than the green candle, then it is a much stronger signal.
Three White Soldiers Pattern

Just like the name indicates, this pattern is composed of three candlesticks. In addition, the pattern comprises three green candles.
These candles have small wicks, and the opening and closing points are higher than the previous day.
This candlestick pattern indicates that there is soon going to be a bullish trend in the market.
Apart from these, there are several candlestick patterns that are very helpful when you are looking for the right opportunity to trade.
Technical Indicators
Intraday trading and technical indicators often go hand in hand. However, there are a lot of people who still doubt the use of technical indicators and the signals that they give.
You can use the technical indicators with a lot of charts and use the mathematical signals to make the best out of the opportunity.
There are a lot of technical indicators available for a better analysis, but the question is, which indicator is best for intraday trading? Let us look at some of the indicators.

RSI Indicator
RSI or relative strength index is a momentum indicator and is helpful for a trader to know the momentum and market trends of a particular stock.
The RSI is depicted using a single line and has a specific range. The range is between 0-100, and you can set it according to your needs and financial goals. The upper band represents the overbought condition, and the lower band represents the oversold condition.
For example, if you set the range from 70-30, 70 is the overbought situation, and 30 is the oversold situation.
The default time period of RSI is set at 14 periods, but you can change this as well. The ideal time for intraday RSI is from 8-11 period as it increases the sensitivity of the indicator and helps in generating faster and better signals.
Let us look at the best RSI setting for intraday.
| RSI Setting for Intraday | |
| Range | Right Buying Time |
| 30-70 | Around 50 |
| 20-80 | Around 60 |
MACD
MACD or moving average convergence divergence is another popular indicator used by intraday traders. It is a trend-following indicator, and it is capable of generating significant signals.
MACD is composed of the difference between the two different periods’ moving averages. The values are usually a 26-period exponential moving average and a 12-period exponential moving average. This comprises the MACD line.
The signal line is formed with the 9-period exponential moving average. When the MACD line crosses the signal line from above, the trend is bearish.
If the MACD line crosses the signal line from below, it indicates a bullish trend. Generally, the MACD setting of 26,12,9 is a good setting for intraday, but a lot of traders also use 5,35,5 or 3,10,16 depending on the requirements.
There is also a histogram in the MACD indicator that signifies the volatility and the strength of the trend. Apart from the histogram, there is a zero line as well. This line separates the positive trend from the negative.
In this way, you can easily use the MACD indicator and make the best profits in intraday trading.
ADX
ADX or Average Directional Moving Index is another popular indicator used by intraday traders. This indicator is used to determine the strength of ongoing strength in the market.
If you are wondering how to use the ADX indicator for day trading, then make sure that you are using shorter time frames since intraday trading is quick.
In cases where the value of ADX is between 0-25, it indicates that the market is in a consolidation phase at that time.
Any value above 25 indicates that there is a strong trend strength in the market. If the market is showing a bullish trend, that means that the bullish trend will go in for some more time.
Although you can set the time frame of ADX according to your needs, for intraday trading, a time period of 3-5 minutes is considered ideal.
Moving Averages
The moving average is one of the most simple and widely used indicators in the stock market. It is a trend indicator and works well over a period of time.
In moving average, the closing points of a certain period are taken and then plotted with a line.
The default setting is of 50-periods but in intraday trading, the period of anywhere around 9-10 also works. Although the moving averages work well over some time you can use them for intraday trading as well.
Bollinger Bands
Bollinger bands are a volatility indicator and as we know that volatility is a key part of intraday trading, it is important that you pay special attention to that as well.
There is a simple moving average in between and the two bands are also trendlines plotted on either side of the SMA. The whole thing appears like an envelope.
The more the volatility, the more the bands broaden. Usually, the SMA is kept for 20 periods, but it can be modified according to the requirements.
These are some of the most commonly used technical analysis tools for intraday trading.
Best Combination of Technical Indicators for Intraday Trading
Technical analysis of intraday trading includes the proper use of technical indicators. While the technical indicators essentially give you great trading signals, it is always better to verify the information using different indicators.
The indicators are divided into three categories, momentum indicators, trend-following indicators, and volatility indicators.
When combining technical indicators, one should keep in mind that all the indicators should be of different categories. For example, you should combine a momentum indicator with a volatility indicator or trend indicator.
If we combine the indicators of the same category, it might give rise to duplicate signals and overconfidence that the signals are always correct.
A combination that you can use is RSI, ADX, and Bollinger bands. Being from different categories, they do not produce any false or duplicate signals.
Conclusion
Technical analysis of intraday trading plays an essential role in intraday trading. For every question about how to do intraday trading, the answer is that you learn the technical analysis and then trade according.
You can use various chart patterns and indicators to conduct a proper technical analysis. Based on your analysis, you can buy the best intraday stocks and reap the profits of the same.
If you are looking to make great profits in trading, open demat account today!
FAQ
Which technical analysis is best for intraday trading?
There are a couple of indicates you can choose:
- Moving Averages
- Relative Strength Index (RSI)
- Bollinger Bands
- MACD (Moving Average Convergence Divergence)
- Stochastic Oscillator
- Fibonacci Retracements
- Volume Analysis
- Pivot Points
- Ichimoku Cloud
- Average True Range (ATR)
- On-Balance-Volume (OBV)
- Advanced-Decline Line
- Supertrend Indicator
Each tool serves a specific purpose in analyzing price movements and making informed decisions during intraday trading. Traders often use a combination of these tools for a comprehensive analysis.
Related Blog
Zinc Price Forecast for Next Week (3rd Aug - 7th Aug 2026) Support 2 Support 1 CMP Resistance 1 Resistance 2 325 333.50 341.15 349.50 358 Aluminum prices ended the week higher as escalating Middle East tensions raised concerns over potential supply disruptions from the Gulf region and lifted energy costs, supporting market sentiment. Additional support came from tightening exchange inventories, with available LME aluminum stocks falling to a 16-month low of 245,350 tones, highlightin
31 July 2026

Natural Gas Price Prediction for Next Week (3rd Aug- 07th Aug 2026) Support 2 Support 1 CMP Resistance 1 Resistance 2 244 257 263 281 294 NYMEX natural gas prices declined around 4% during the week as improving shipping conditions through the Strait of Hormuz and steady LNG arrivals into Europe eased supply concerns. Qatar dispatched its first LNG cargo through the waterway in over three weeks, while stable Norwegian pipeline flows further improved the supply outlook.In the US, the E
31 July 2026

Crude Oil Price Forecast for Next Week (3rd Aug - 07th Aug 2026) Support 2 Support 1 CMP Resistance 1 Resistance 2 7379 7628 8096 8429 8854 WTI Crude Oil prices declined on a weekly basis as tanker traffic through the Strait of Hormuz recovered, easing immediate concerns over supply disruptions after recent delays. Saudi Arabia also held talks with representatives from 43 countries to establish a maritime coalition aimed at securing Sea shipping routes. Despite the weekly decline, cr
31 July 2026
Made for Traders.
Trusted by Investors.
Download FinX — trade confidently, invest
smarter, track everything.
