
Intraday trading without technical indicators is like a car with a tank full of fuel but no one to drive it. You might have often heard that technical indicators help in improving the efficiency of intraday trading. One such indicator is RSI. So, let us talk about the best RSI setting for intraday.
RSI or the Relative Strength Index is a commonly used indicator by intraday traders as it is very effective in generating the right signal.
Every indicator has different settings and periods that can be used to generate the most appropriate signals. The same is the case with RSI. It is therefore important to understand the best RSI setting so that you can make the best of the intraday trading time.
So, let’s begin!
How To Use RSI Indicator for Intraday Trading?
The relative Strength Index is a momentum indicator. It helps in reading the market trends and then a trader can further look for the overbought or oversold situations.
Intraday traders can benefit a lot from the RSI indicator because the trend is essential for intraday traders and this indicator aids the observation of the same.
Although it is such a great indicator, a lot of traders often avoid using the RSI indicator. Why? Because of the lack of experience and knowledge of how to use the indicator properly.
So, you can easily apply the RSI indicator for intraday trading and on any stock using the FinX app of Choice. Let us have a look at how you can do that.
- Log in to the app using your login credentials and password.
- Now you will see a dashboard with a different watchlist. Search for the stock that you are looking to trade in.
- Once you have selected the stock, click on the ‘chart’ option.
- Now you will see an option of studies. Search for the RSI indicator there and select it.

- You can now select the best setting for RSI by entering the period and the overbought and oversold conditions.

You can apply and use the RSI indicator for intraday trading easily using the above steps. Now the main motive here is to know what is the best setting and how you can use it to maximize your profits.
Best Setting For RSI Indicator for Intraday
Now when you are trading in the stock market, you have different goals and also different objectives. It is important that you plan your intraday trading strategies, according to the same.
Depending on the same, you can adjust the settings of RSI. RSI, as we discussed above is used to study the market trend and decide the overbought and oversold situation. But how to determine that?
So, the default setting of the RSI indicator is 14 periods. This means that the last 14 candles or bars are used to calculate the indications. Along with this, there are certain ranges of the RSI indicator as well.
This range is between 0-100. You can set this range according to your trading goals. The lower band determines the oversold condition, and the upper band determines the overbought condition.
If we understand this more clearly if the range is set from 30-70, then 30 is the oversold situation and 70 is overbought.
The oversold situation is usually a buy signal and overbought a sell signal. But the 14 day period is usually more efficient for swing traders.
So what period of RSI should intraday traders should choose?
Although the default setting is 14, the intraday traders usually prefer a range of 8-11 periods.
Now this range is reduced to increase the sensitivity and also to monitor the market closely so that you can efficiently trade within minutes.
If you are setting a range of 70-30, then 50 is a potential buy signal.

If the range is set for 80-20, then the potential buying signal is around 60.

Usually, it is advisable that you use two or three intraday trading indicators in certain combinations. You can check the list of the best combination of technical indicators for intraday trading to generate confirmed signals.
Conclusion
RSI indicator is one of the most used momentum indicators owing to the fact that it studies the market trend and then generates a signal.
You need to set the time period according to your own needs and investment plans. To do intraday trading it is often recommended to use shorter periods so that he/she can monitor the market with each minute.
So, once you know the best RSI setting for intraday trading, you can efficiently earn profits.
If you are also looking to earn sufficient profits from intraday trading, begin by opening Demat account today!
FAQ
What is The Best RSI Settings For 1-Minute Chart?
A common RSI setting for a 1-minute chart is 14 periods, with oversold and overbought levels set at 30 and 70. However, you might adjust the period depending on your trading style, risk tolerance, and market conditions.
Testing different RSI settings is crucial to find the one that aligns with your strategy. It's also wise to combine RSI with other analyses to confirm signals and avoid false breakouts.
How Is The RSI Indicator Calculated?
The RSI formula considers average price increases and decreases over a set period. The calculation is: RSI = 100 – (100 / (1 + RS)), where RS equals the average gain divided by the average loss for the chosen period.
Related Blog
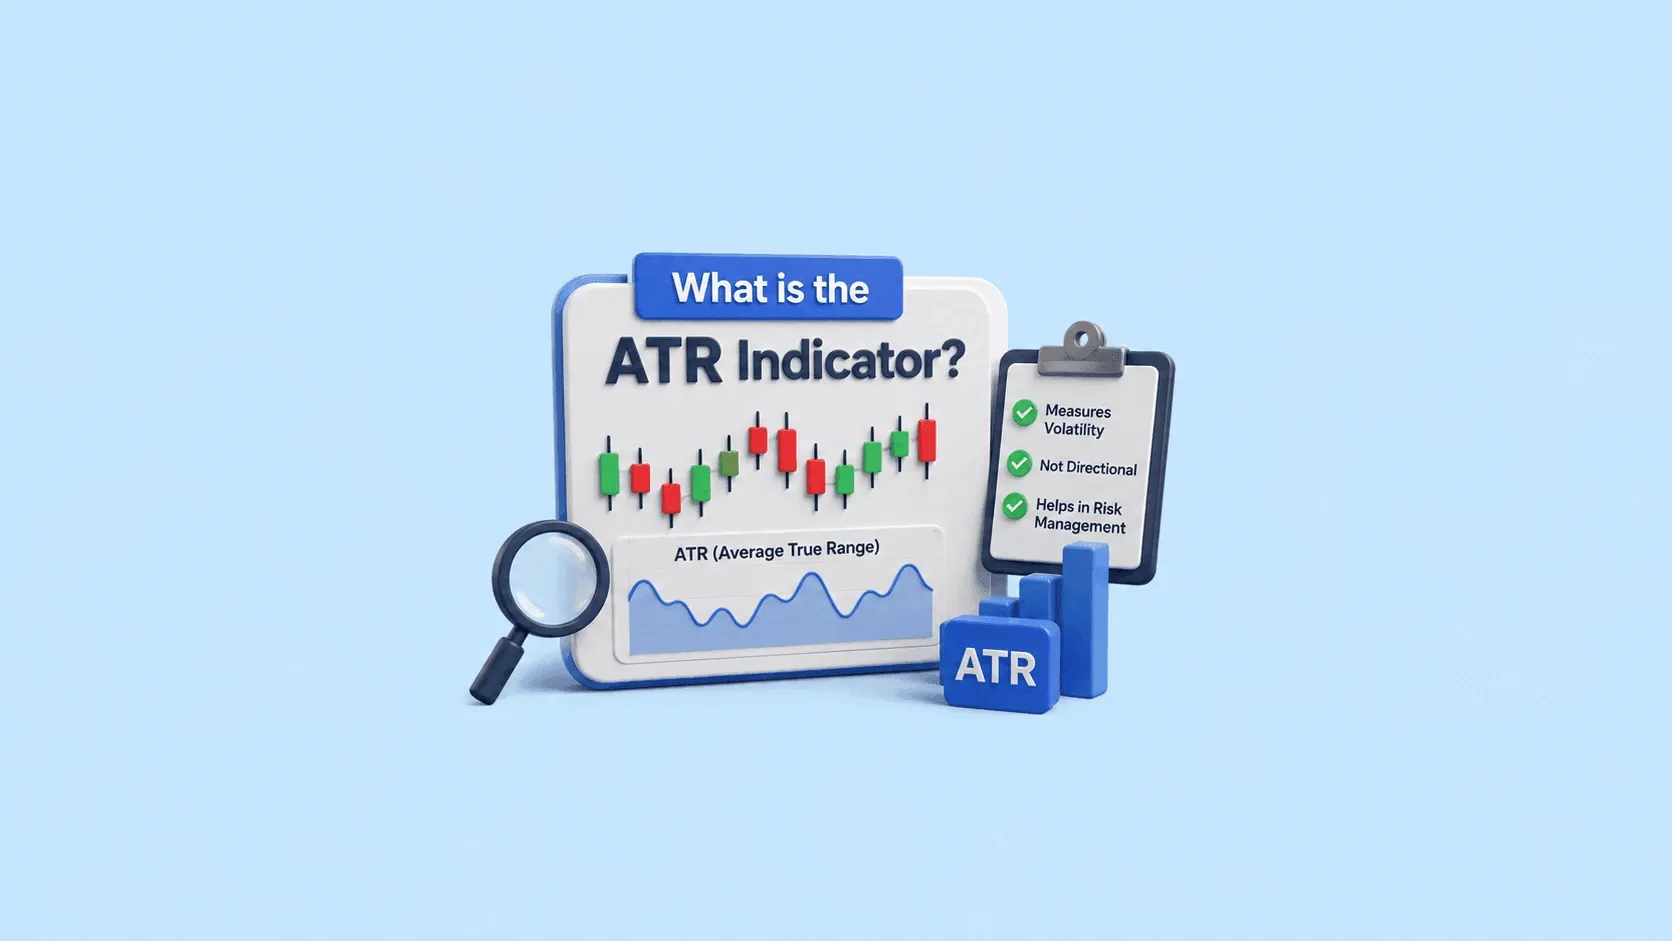
If you’re a trader whose technical analysis involves watching price movement, there is one indicator you should understand: the Average True Range. Unlike most indicators that focus on where the price is moving, ATR focuses on how much it is moving and how volatile the market can prove to be. In this guide, we will cover what Average True Range is, how it is calculated, and how it can be used to make smarter trading decisions. What is the ATR (Average True Range) Indicator? Average True Rang
16 July 2026

When you place a buy or sell order in the stock market, you may notice different order types offered by your broker. One such order type is the IOC order. Understanding what is IOC in the stock market can help you execute trades more efficiently, especially when prices change quickly. Whether you're a beginner or an active trader, knowing the IOC full form, how it works, and when to use it can help you make better trading decisions in the Stocks market. What is IOC? The IOC (Immediate or Can
16 July 2026

FII DII Data Today 16th July 2026 CATEGORY DATE BUY VALUE (₹ Crores) SELL VALUE (₹ Crores) NET VALUE (₹ Crores) DII 16-July-2026 17,192.66 14,825.78 2,366.88 FII 15-July-2026 13,013.48 16,460.66 -3,447.18 What are FII and DII in the Stock Market Foreign Institutional Investors (FIIs) invest in the Indian stock market from international markets, while Domestic Institutional Investors (DIIs) include mutual funds and institutional bodies operating from India. fii dii data helps tra
15 July 2026