
Which indicator is best for intraday trading? Have you ever wondered the same?
There are a plethora of technical indicators available for traders. However, it sometimes becomes challenging to choose one, considering that the market volatility is unpredictable and earning money from intraday trading can become complicated.
Therefore, it is essential that you pick the right indicator so that you can make money from intraday trading efficiently.
Best Indicator for Intraday Trading
Technical indicators are critical when it comes to intraday trading. They ensure that you pick the right stock for intraday trading and enter and exit at the right time.
There are different types of technical indicators, including momentum indicators, trend-following indicators, and volatility indicators.
In this article, we will talk about the best indicator for intraday trading.
- Relative Strength Index
- Moving Averages convergence divergence
- ADX
Let us now talk about them one by one.
RSI
Relative Strength Index or RSI is one of the most commonly used indicators in intraday trading. RSI is a momentum indicator and is very useful when a trader is looking for a trend reversal or just the movement of the market.
RSI has a range of 0-100, and a trader can select the range accordingly. However, the most common range that the traders use is 30-70.
You can define the overbought and oversold conditions of the market using these indicators. This further helps a trader decide the position they want to take in the market.
Now, there are two lines formed according to the ranges. The upper band, i.e., the one with the higher value, signifies the overbought situation. This means that particular security has been bought beyond the expectations of the market.
But what is the significance for a trader?
If the security has reached the RSI around the overbought situation, it is the right time for the trader to either exit the existing position or take a short position.
It is because now there are chances that the market will move in a bearish direction. So in a sense, the market will reverse.
Similarly, when the market touches the lower level, it indicates that the security has been sold more than the market expectations and has been oversold.

This is a potential place for a trader to take entry into stock. Apart from the ranges, there are also time periods for RSI. The default period is set at 14. This means that the result is calculated using the last 14 bars or candles of a particular chart.
But what is the best RSI setting for intraday?
So, the time period defines the sensitivity of the RSI. If you are an intraday trader, then you know that there is only a limited intraday trading time, and in that, you need to maximize the gains.
Therefore, a lot of intraday traders use a lesser time period. They can choose it as low as 5 as well, and somewhere between 8-9 as well.
The increased sensitivity of RSI can yield early and quick results in the case of intraday trading and thus is beneficial.
There are three RSI settings in the given image: 14 period, 8 period, and 5 periods. In the 14 periods setting the sell, the signal is comparatively later than the 5 periods and 8 periods.

You can use RSI divergence to identify the possible trend reversals in intraday trading. If the RSI is moving downwards and the price is moving upwards, then there is a clear indication of a trend reversal.
So, in this way you can use the RSI indicator and get good signals to trade in a single day.
MACD
MACD or moving average convergence divergence is another very commonly used technical indicators for intraday trading. This indicator is used to detect the market trends because it is a trend following indicator. The indicator generally comprises three lines.
- MACD line- Formed with the difference between 26 periods exponential moving average and 12-period exponential moving average.
- Signal line- The calculation of 9-period exponential moving averages forms the signal line.
- Zero line- Separates the negative and the positive histogram.
Apart from these lines, there is also a histogram in the MACD indicator. You can use the histogram where the signals from MACD are delivered a little later or are lagging in some sense. The divergence between the MACD line and the signal line also impacts the width of the histogram.
But how?
The more difference between the signal and the MACD line, the more wide the histogram is.
Now, the MACD indicator gives the signal with its crossovers. Let us have a look at how.
- When the MACD line crosses the signal line from below, then the trend in the market is bullish. So, if the traders are looking for an opportunity to enter the market, this might be the right time.
- On the other hand, when the MACD line crosses the signal line from above, the trend in the market is bearish, thus the perfect opportunity to exit. Also, the traders who want to short their positions can also use this as an opportunity.

- When the crossovers happen above the zero line, this forms a positive histogram.
- Similarly, when the crossovers are below the zero line, a negative histogram appears.
- If there are multiple crossovers above the zero line, then the market is moving in the consolidation phase.
Therefore, if you are looking for which indicator is best for intraday trading, MACD can be your answer.
ADX
The average directional movement index is a trend indicator. Intraday traders use ADX to determine the strength of the trend. There are various ranges in the ADX indicator as well. Let us now have a look at how to use the ADX indicator for day trading.
ADX is a non-directional indicator and only tells the strength of an ongoing trend. This means that even when the market is bearish, the values of ADX will rise.
- If the value of the ADX indicator is between 0-25, this means that the current market is in the consolidation phase.
- If the ADX is above 25, and the market is bullish, the bull run will continue for some time. Thus, this is the perfect time for the traders to take a long position.
- In the case where the ADX is above 25, and the market is bearish, the bearish trend will continue for some time. Traders can either take the short position in this or exit the existing positions.
In the given image, the ADX is around 32, which indicates a very strong trend. Since the ongoing trend was bullish, the same goes on for a while.
The default setting in ADX is of 14 periods, but as an intraday trader, the lesser the time, the better the signals. You can set the same for 7-8 periods for better results.
These are some of the best indicator for intraday trading. However, these indicators work individually as well but are always better to use a combination of technical indicators for intraday trading for guaranteed results.
Conclusion
You can use a lot of technical indicators for intraday trading. They make sure that your trading experience becomes smoother and you earn good profits. ADX, MACD, and RSI work great when you use the right setting and right strategies. You can use the indicators individually and also in combinations.
If you are looking to earn profits from intraday trading, you can open a free Demat account today!
Related Blog
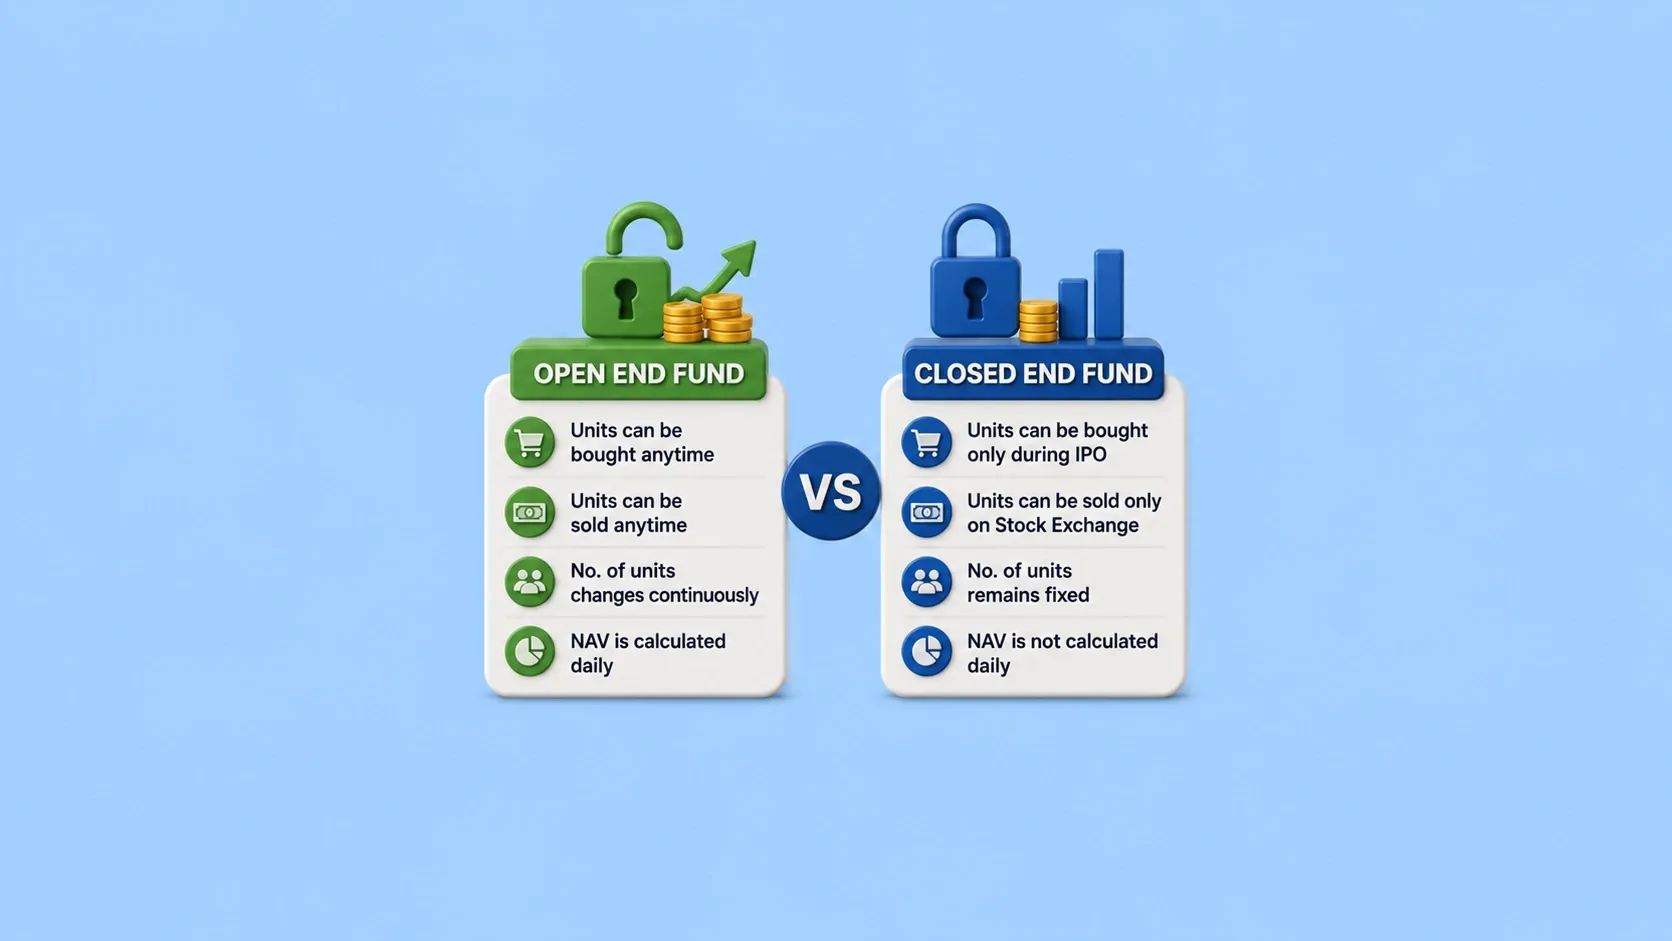
Many investors begin their Mutual fund journey to grow their wealth, but terms like open-end funds and closed-end funds can often be confusing. While both are regulated by SEBI, they differ in how you invest, redeem your money, and the level of flexibility they offer. Choosing the right one depends on your financial goals, investment horizon, and liquidity needs. In this article, we'll explain what an open-ended mutual fund is, what a closed-end fund is, the difference between open-ended and cl
31 July 2026
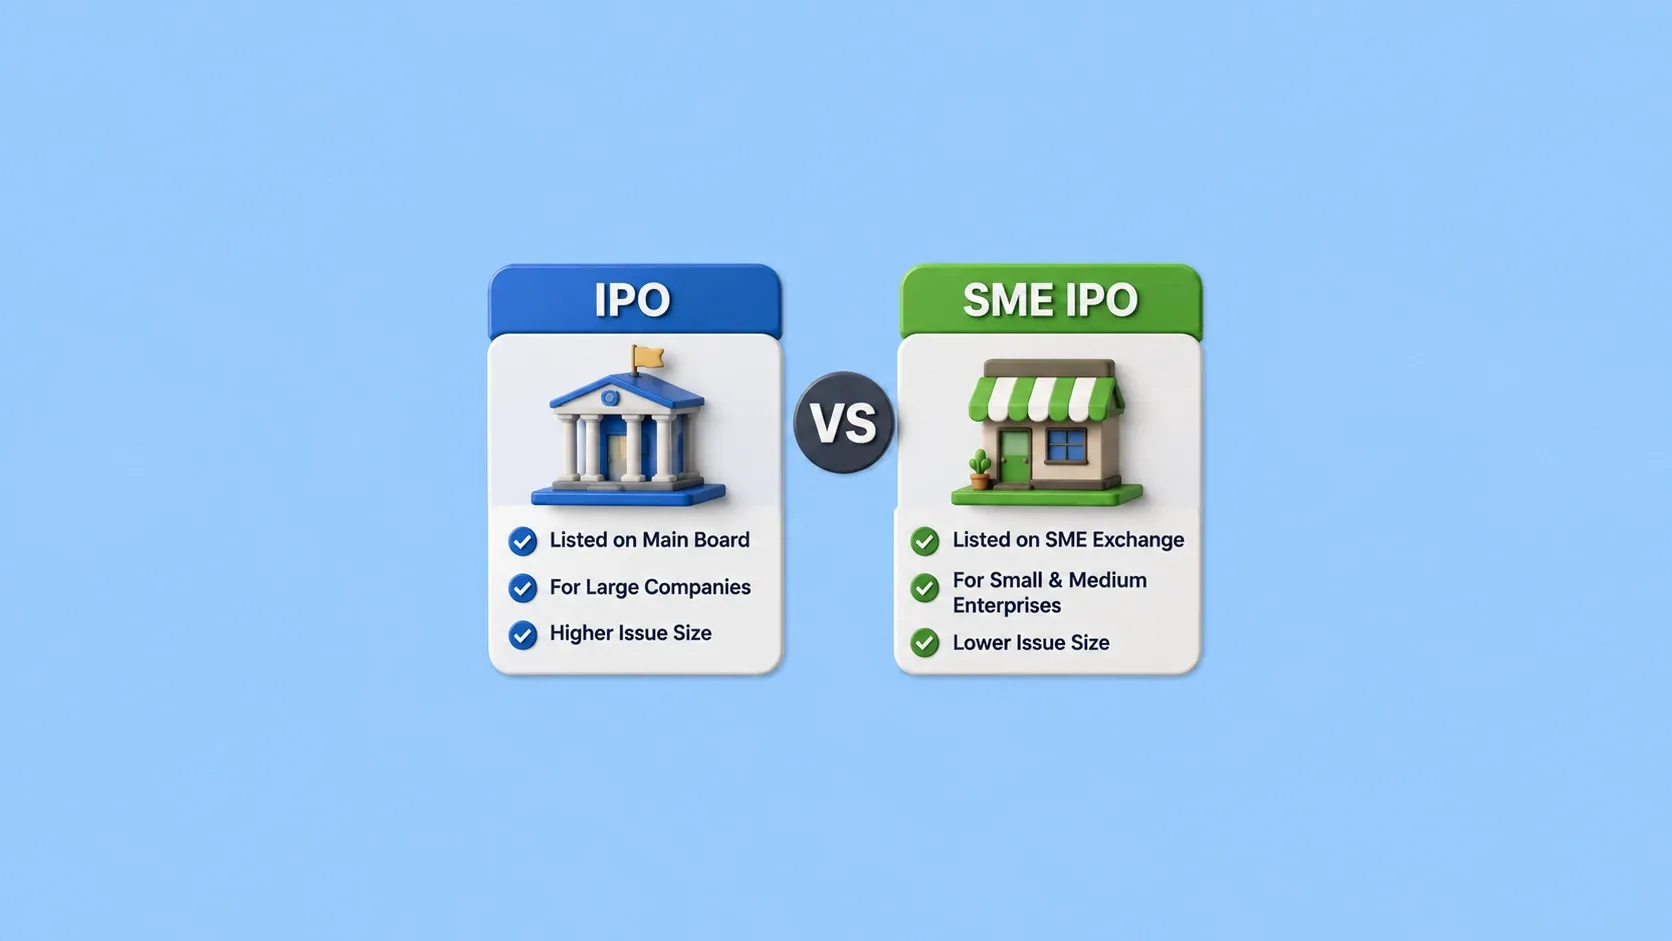
If you have ever browsed through IPO websites, you must have seen sections mentioning “Mainboard IPOs” and “SME IPOs”. They are both termed IPOs, but what is the difference between them? Understanding this difference matters, especially if you are new to investing in IPOs. In this blog, we will discuss what a Mainboard IPO and an SME IPO actually are, how they differ, the key differences in their risk characteristics and how you can apply to one through Choice. What Is a Mainboard IPO? A Mai
31 July 2026
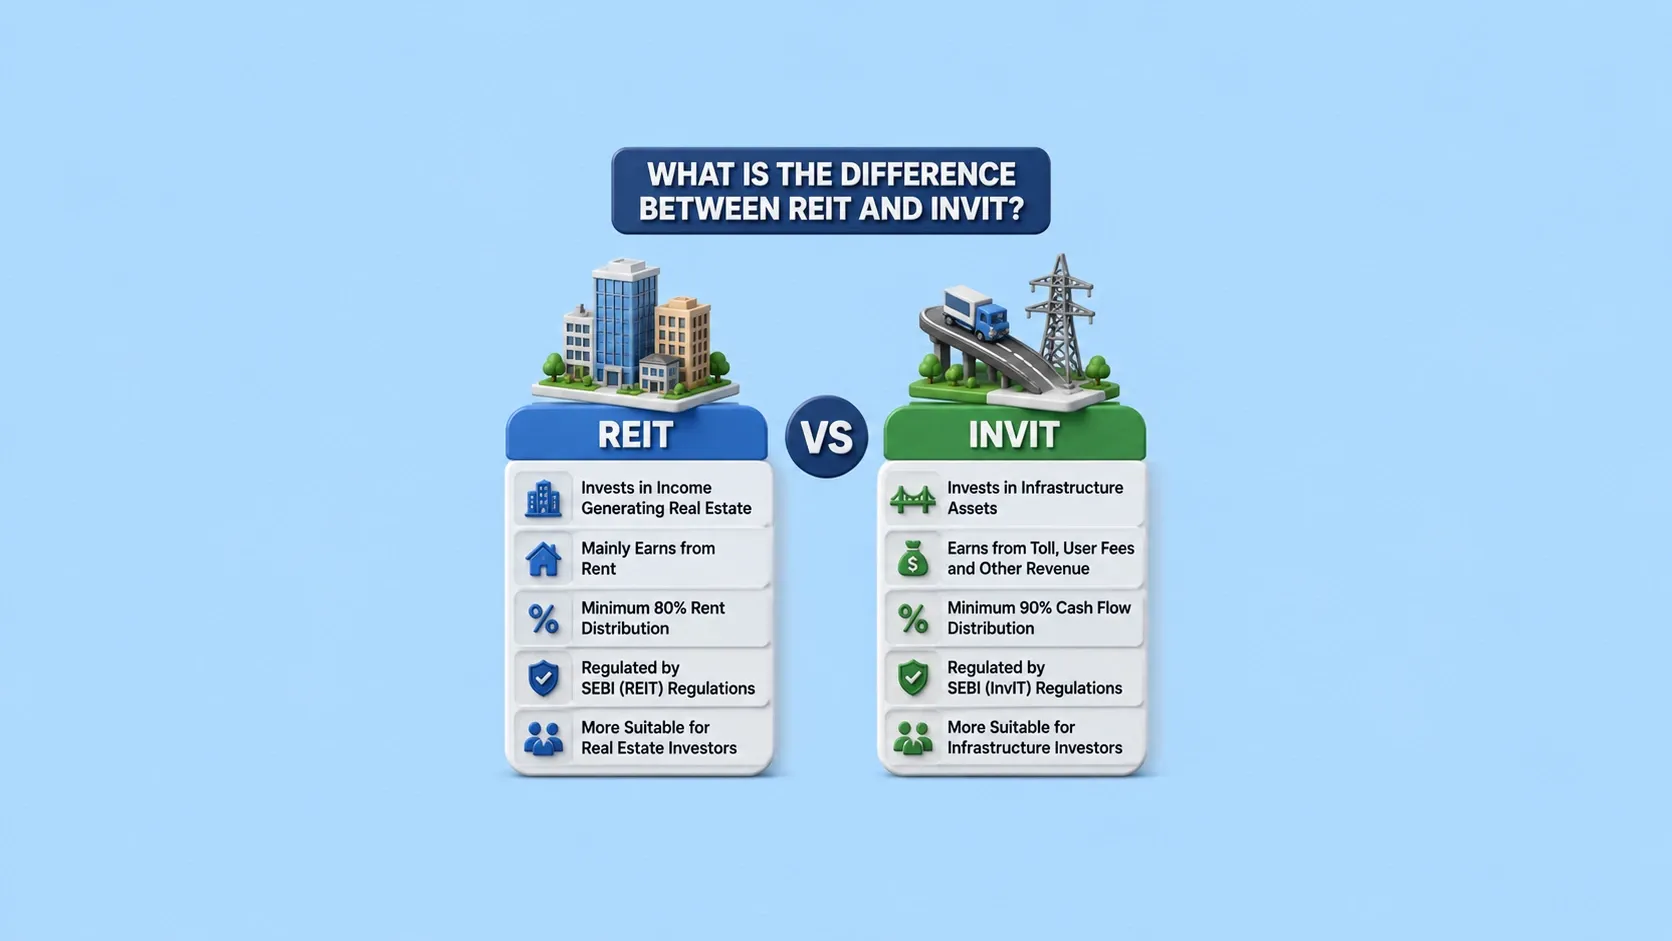
If you're looking to diversify beyond stocks, mutual funds and fixed deposits, REITs and InvITs are two investment options worth understanding. They both allow you to invest in large-scale assets such as Real Estate and infrastructure, without buying them directly. While they might have some similarity, they invest in different types of assets, carry different risk profiles and are suited for different kinds of investors. In this blog, we will learn what each instrument is, how they compare to
31 July 2026
Made for Traders.
Trusted by Investors.
Download FinX — trade confidently, invest
smarter, track everything.
