
Trading indicators are essential tools for traders when analysing financial markets. These indicators use mathematical calculations based on price, volume, or open interest, providing insights into potential market trends and price movements. By interpreting signals generated from these indicators, traders can make informed decisions about entry and exit points, risk management, and overall strategy.
Whether you're a beginner or an experienced trader, understanding and effectively using trading indicators can significantly enhance your trading performance. To get started, you'll need to open a trading account. This article explores various types of technical indicators, highlighting their importance and how they can be applied in different trading scenarios.
What Are Trading Indicators?
Trading indicators are mathematical tools derived from the price, volume, or open interest of a security or contract. Traders use these indicators to analyse past market movements and forecast future price directions. Typically plotted as lines on a price chart, they help identify specific signals and trends within the market.
What Are the Top 10 Types of Trading Indicators?
Trading indicators are essential tools for analysing financial markets and making informed trading decisions. Below are the best indicators for intraday trading used by the top traders in India:
1. Moving Average (MA)
A moving average smooths out price data to create a single flowing line, making it easier to identify the direction of the trend. There are different types of moving averages, such as the simple moving average (SMA) and the weighted moving average (WMA). The SMA is calculated by averaging a set number of past prices, while the WMA gives more weight to recent prices.

Example:
Let's say we want to calculate a 5-day SMA for a stock. We'll use the closing prices for the last 5 days:
- Day 1: ₹105
- Day 2: ₹100
- Day 3: ₹108
- Day 4: ₹102
- Day 5: ₹110
SMA = (100 + 105 + 102 + 108 + 110)/5 = ₹105
This means that over the past 5 days, the stock's average closing price was ₹105.
2. Exponential Moving Average (EMA)
The EMA gives more weight to recent prices, making it more responsive to new information. This helps traders identify trends more quickly compared to the simple moving average. The EMA is calculated by applying a multiplier to the most recent price, which gives it more significance in the calculation.

3. Moving Average Convergence Divergence (MACD)
MACD is a trend-following momentum indicator that shows the relationship between two moving averages of a security’s price. It consists of the MACD line, the signal line, and the histogram. The MACD line is the difference between the 12-day and 26-day EMAs, while the signal line is a 9-day EMA of the MACD line. The histogram represents the difference between the MACD line and the signal line. MACD helps traders identify potential buy and sell signals.

Example
Let's calculate the MACD for a stock using the following data:
- 26-period EMA: 105
- 12-period EMA: 110
- 9-period EMA (Signal Line): 98
Calculation
- MACD Line: 110 - 105 = 5
- Signal Line: 98
- Histogram: 5 - 98 = -93
Interpretation
- When the MACD Line crosses above the indicator Line, it is usually regarded as a bullish indicator. When the MACD Line crosses below the indication Line, it is usually regarded as a negative indication.
- If the price makes a new high while the MACD makes a new low (or vice versa), this might indicate a possible reversal.
- The histogram depicts the intensity of the MACD signal. A positive histogram implies a bullish trend, whilst a negative histogram shows a bearish one.
4. Stochastic Oscillator
This momentum indicator compares a particular closing price of a security to a range of its prices over a certain period. It consists of two lines: %K and %D. The %K line represents the current price relative to the range, while the %D line is a moving average of %K. The stochastic oscillator helps identify overbought and oversold conditions, indicating potential reversal points.

5. Bollinger Bands
Bollinger Bands consist of a middle band (a moving average) and two outer bands that are standard deviations away from the middle band. The bands expand and contract based on market volatility. When the price moves closer to the upper band, it may indicate overbought conditions, while a move closer to the lower band may indicate oversold conditions. Bollinger Bands helps traders identify volatility and potential price reversals.

Example
Let's calculate the 20-period Bollinger Bands for a stock using the following data:
- Standard Deviation: 10
- 20-period SMA: 100
Calculation
- Upper Band: 100 + (2 * 10) = 120
- Lower Band: 100 - (2 * 10) = 80
Interpretation
- Wide bands imply considerable volatility. A narrow band suggests little volatility.
- If the price approaches or exceeds the top band, it may indicate that the stock is overbought. If the price approaches or exceeds the bottom band, it may indicate that the stock is oversold.
- A price breakthrough above or below the top band may indicate a possible reversal.
6. Relative Strength Index (RSI)
RSI measures the speed and change of price movements. It ranges from 0 to 100 and helps identify overbought or oversold conditions in a market. An RSI above 70 typically indicates overbought conditions, while an RSI below 30 indicates oversold conditions. RSI can also be used to identify divergence, which occurs when the price moves in the opposite direction of the RSI, signalling a potential reversal.

7. Fibonacci Retracement
This stock trading indicator uses horizontal lines to indicate areas of support or resistance at the key Fibonacci levels before the price continues in the original direction. The key Fibonacci levels are 23.6%, 38.2%, 50%, 61.8%, and 100%. Traders use these levels to predict potential reversal points and to set entry and exit points for their trades.

Example:
Some of the common Fibonacci Retracement Levels are 23.6%, 38.2%, 50%, 61.8%, and 78.6%
Let's say a stock price rises from ₹50 to ₹100. We can use Fibonacci Retracements to identify potential support levels as the price declines.
Price Difference: ₹100 - ₹50 = ₹50
Apply Fibonacci ratios to the price difference:
- 23.6% retracement: ₹50 * 0.236 = ₹11.80
- 38.2% retracement: ₹50 * 0.382 = ₹19.10
- 50% retracement: ₹50 * 0.50 = ₹25.00
- 61.8% retracement: ₹50 * 0.618 = ₹30.90
- 78.6% retracement: ₹50 * 0.786 = ₹39.30
Interpretation:
If the price drops below ₹100, it may find support around Fibonacci retracement levels. If the price falls below ₹80, it might face resistance around the 61.8% retracement level (₹30.90).
8. Ichimoku Cloud
The Ichimoku Cloud is a comprehensive indicator that defines support and resistance, identifies trend direction, gauges momentum, and provides trading signals. It consists of five lines: Tenkan-sen, Kijun-sen, Senkou Span A, Senkou Span B, and Chikou Span. The area between Senkou Span A and Senkou Span B forms the cloud (Kumo). The Ichimoku Cloud helps traders make more informed decisions by providing a holistic view of the market.

9. Standard Deviation
Standard deviation measures the dispersion of a set of data from its mean. In trading, it helps assess the volatility of a security’s price. A higher standard deviation indicates higher volatility, while a lower standard deviation indicates lower volatility. Traders use standard deviation to gauge the risk associated with a particular security and to identify potential price movements.

10. Average Directional Index (ADX)
ADX is used to quantify the strength of a trend. It ranges from 0 to 100, with higher values indicating a stronger trend. An ADX value above 25 typically indicates a strong trend, while a value below 20 indicates a weak or non-trending market. ADX helps traders determine whether a market is trending or ranging, allowing them to adjust their trading strategies accordingly.

Risk and Limitation of Trading Indicators
Trading indicators are tools traders use to analyse market trends and make informed decisions. However, they come with certain risks and limitations that traders should be aware of:
1. Lagging Nature
Most indicators are based on historical data, which means they often lag behind current market conditions. This can result in delayed signals, causing traders to miss potential opportunities or enter trades too late.
2. False Signals
Indicators can sometimes generate false signals, leading traders to make incorrect decisions. This can be particularly problematic in volatile markets where price movements are unpredictable.
3. Over-Reliance
Relying too heavily on trading indicators can lead to a lack of critical thinking and analysis. Traders may become dependent on these tools and ignore other important factors such as market news, economic data, and geopolitical events.
4. Complexity
Some trading indicators can be complex and difficult to understand, especially for beginners. Misinterpreting these indicators can lead to poor trading decisions and potential losses.
What are the Types of Technical Indicators?
Trading indicators help traders analyse market trends and make informed decisions. Here are five common types of technical indicators:
| Indicator Type | Description |
|---|---|
| Trend Indicators | Help determine the overall direction of the market by analyzing historical price data. They identify if the market is in an uptrend, downtrend, or moving sideways. |
| Momentum Indicators | Measure the speed of price changes to identify the strength of a trend. They signal potential reversals or continuations by showing if the market is gaining or losing momentum. |
| Volatility Indicators | Assess the rate of price changes and provide insights into market volatility. Useful for identifying potential breakouts and setting stop-loss levels. |
| Support/Resistance Indicators | Identify key price levels where the market tends to reverse direction. Support levels prevent further price drops, while resistance levels prevent further price rises. Essential for trade entry and exit points. |
The Key Takeaway
Effectively utilising trading indicators can significantly enhance your trading strategy by providing valuable insights into market trends, entry and exit points, and overall asset performance. However, more than relying solely on indicators isn't needed; combining them with solid risk management and market analysis is crucial for long-term success.
Whether you're a beginner or an experienced trader, continuously learning and adapting to market conditions is key. By refining your approach and staying disciplined, you can improve your decision-making and achieve more consistent results in trading. Keep experimenting with different indicators to find what works best for your strategy.
Do you want to learn about stock markets? Read Choice blogs and stay updated about the latest happenings in the market.
FAQs
Q1. Which Indicator is Best For Intraday?
The Volume Weighted Average Price (VWAP) is highly regarded for intraday trading. It helps traders determine the average price based on volume, making it easier to identify trends and make informed decisions.
Q2. What is The Most Accurate Indicator?
The Price Rate of Change (ROC) is considered one of the most accurate indicators. It measures the speed and direction of price movements, providing valuable insights for traders.
Q3. Are Trading Indicators Real?
Yes, trading indicators are real. They are mathematical calculations based on historical price, volume, or open interest data that help traders predict future price movements.
Q4. How do We Confirm A Trend?
To confirm a trend, traders use moving averages, MACD, and RSI to analyse market momentum and price movements, distinguishing genuine trends from temporary fluctuations.
Q5. How to Predict Intraday Trading?
Predicting intraday trading involves selecting technical indicators for stock trading with high liquidity and volatility, using technical analysis tools like chart patterns and indicators, and staying updated with market news.
Related Blog
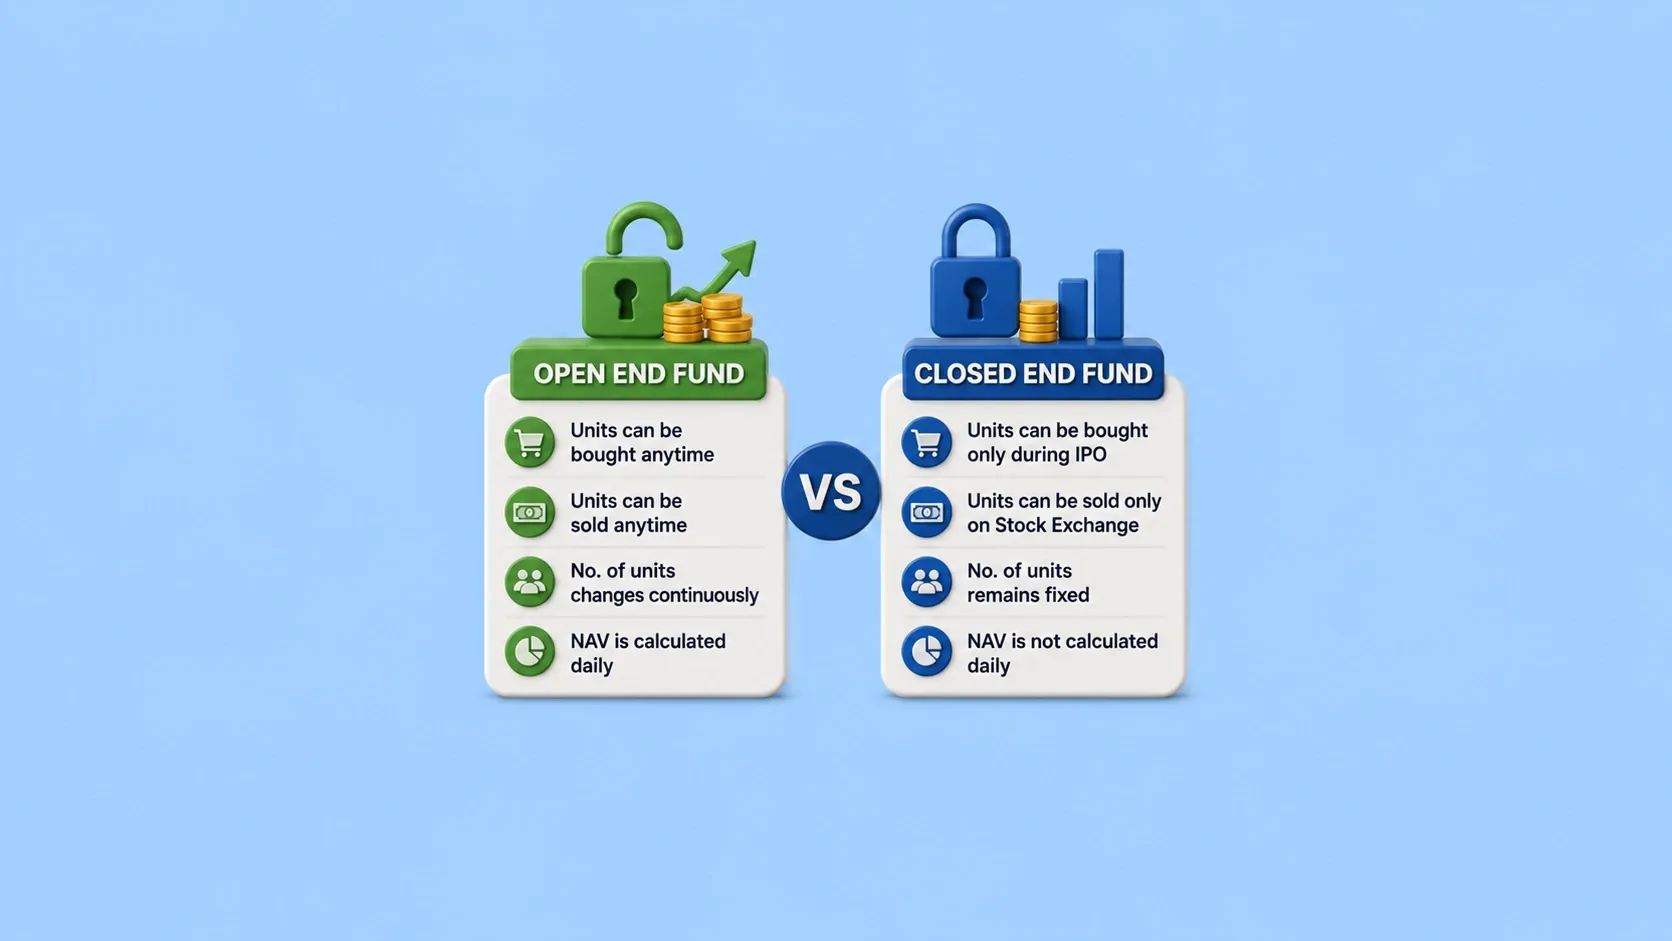
Many investors begin their Mutual fund journey to grow their wealth, but terms like open-end funds and closed-end funds can often be confusing. While both are regulated by SEBI, they differ in how you invest, redeem your money, and the level of flexibility they offer. Choosing the right one depends on your financial goals, investment horizon, and liquidity needs. In this article, we'll explain what an open-ended mutual fund is, what a closed-end fund is, the difference between open-ended and cl
31 July 2026
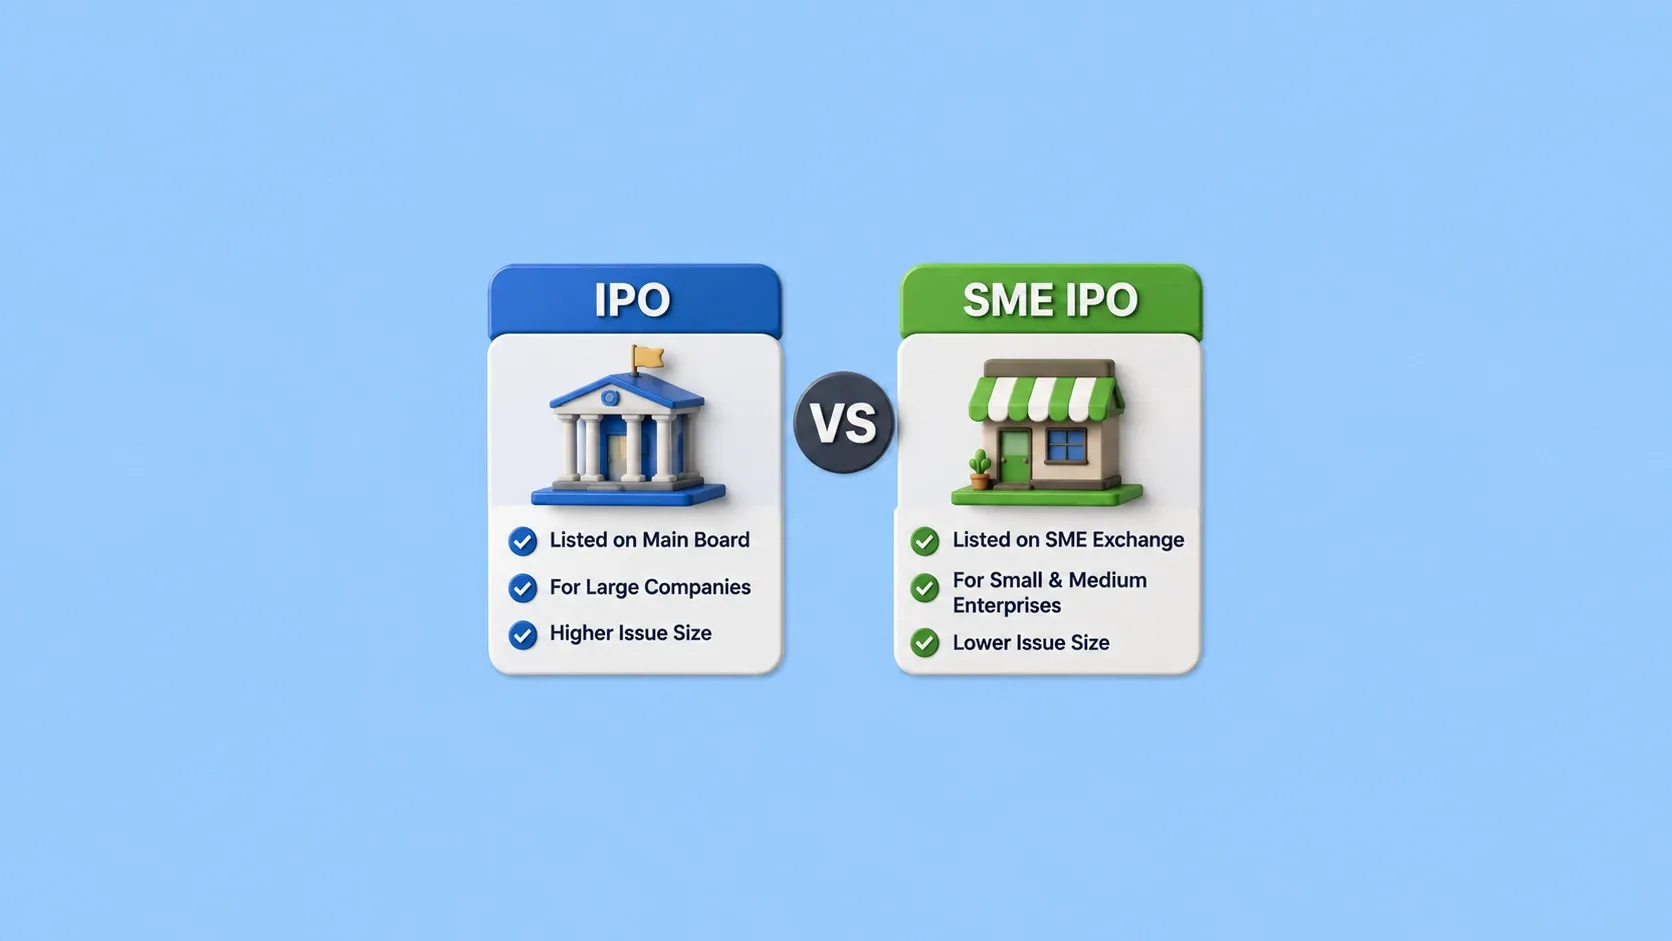
If you have ever browsed through IPO websites, you must have seen sections mentioning “Mainboard IPOs” and “SME IPOs”. They are both termed IPOs, but what is the difference between them? Understanding this difference matters, especially if you are new to investing in IPOs. In this blog, we will discuss what a Mainboard IPO and an SME IPO actually are, how they differ, the key differences in their risk characteristics and how you can apply to one through Choice. What Is a Mainboard IPO? A Mai
31 July 2026
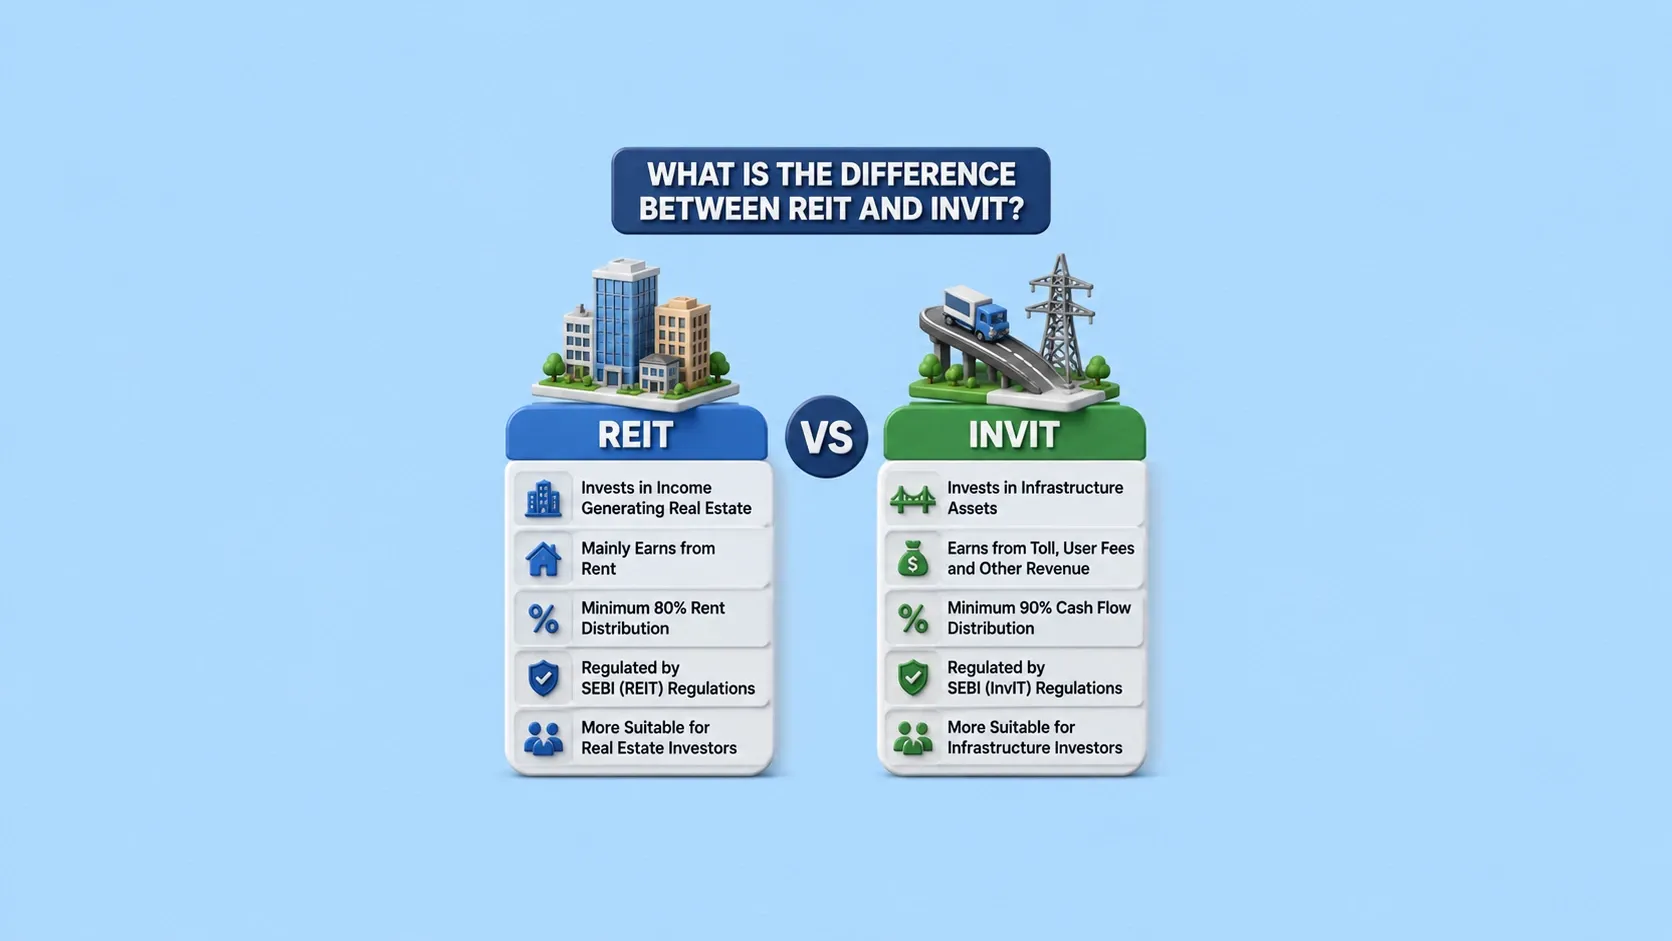
If you're looking to diversify beyond stocks, mutual funds and fixed deposits, REITs and InvITs are two investment options worth understanding. They both allow you to invest in large-scale assets such as Real Estate and infrastructure, without buying them directly. While they might have some similarity, they invest in different types of assets, carry different risk profiles and are suited for different kinds of investors. In this blog, we will learn what each instrument is, how they compare to
31 July 2026
Made for Traders.
Trusted by Investors.
Download FinX — trade confidently, invest
smarter, track everything.
