
Profitability Analysis assesses a company’s ability to generate profits relative to its revenue, assets, or equity over a specific period. It involves the use of financial ratios and key performance metrics to evaluate how well a company is performing and whether its business model is sustainable.
This comprehensive article aims to explain the concept of profitability analysis and provides a roadmap for evaluating the financial performance of any company.
What is Profit?
Profit is the surplus remaining after a company has deducted its expenses from its revenue. It's the ultimate measure of a company's success, reflecting how efficiently it operates in its market.
What is the Profitability Analysis of a Company?
Profitability analysis of a company involves evaluating the financial performance to determine how effectively the company generates profits relative to its costs and investments. It is a critical process for understanding whether the company can sustain its operations and continue growing. By conducting profitability analysis, stakeholders can make informed decisions about investments, cost-cutting, or operational improvements.
Profitability analysis typically involves comparing financial data over time across different companies in the same industry or against pre-set benchmarks. This detailed assessment can be done through quantitative and qualitative methods, often using a combination of profitability ratios and other key performance indicators (KPIs).
Importance of Profitability Analysis
The significance of profitability analysis cannot be overstated. Here's why it's important:
Helps in Decision Making: It guides managers and investors in making strategic decisions, such as expanding operations, reducing costs, or exiting unprofitable markets.
Assesses Financial Health: Profitability metrics give a snapshot of a company's financial strength and operational efficiency.
Informed Investment Decisions: Investors rely on profitability ratios to decide whether a company is a worthwhile investment.
Benchmarking: Companies can compare their performance against competitors or industry standards.
Identifies Trends: It helps in detecting both positive and negative profitability trends over time.
Key Elements of Profitability Analysis
The goal of profitability analysis is to provide a comprehensive view of how well a company is generating profits and using its resources. Below are the key elements of profitability analysis:
Break-even analysis:
Break-even analysis is a fundamental tool in profitability analysis that helps businesses determine the point at which total revenue equals total costs. At this point, the company neither makes a profit nor incurs a loss, and it is referred to as the break-even point.
The break-even point is calculated by dividing fixed costs by the contribution margin per unit (which is the selling price per unit minus the variable cost per unit). It helps a company understand the minimum level of sales needed to avoid a loss and how pricing or cost structures impact profitability.
Profitability ratios:
Profitability ratios are financial metrics that quantify a company's ability to generate profit relative to its revenue, assets, equity, and other financial factors. These ratios are critical in profitability analysis as they provide a clear picture of financial performance. We’ll explore some of the important profitability ratios in detail below.
Profitability ratios provide quantifiable benchmarks that allow businesses to measure their performance against industry peers or over time. They are crucial for comparing a company's profitability to competitors and assessing its financial viability.
Customer profitability analysis:
Customer profitability analysis (CPA) is a method that assesses the profitability of individual customers or customer segments. Instead of focusing solely on overall revenue, CPA looks at how much profit is generated from different types of customers. This analysis helps a company understand which customers are contributing most to its bottom line and which are draining resources.
CPA enables businesses to make more strategic decisions about marketing, sales, and customer service investments. By identifying the most profitable customers, companies can allocate resources more effectively, develop better-targeted marketing campaigns, and improve customer retention strategies. Additionally, it helps to eliminate unprofitable customers or restructure terms to make them more profitable.
Qualitative analysis:
While quantitative measures like ratios and financial figures are important, qualitative analysis plays a crucial role in profitability analysis by considering non-numeric factors. Qualitative factors may include market trends, competitive positioning, customer satisfaction, brand reputation, regulatory risks, and management efficiency.
Qualitative analysis provides context for financial numbers, offering a broader perspective on profitability. For instance, a company with strong financial metrics but poor customer satisfaction might not be profitable in the long run. Similarly, qualitative factors like regulatory changes or industry disruptions can greatly impact future profitability.
Important Profitability Ratios for Company Profitability Analysis
Profitability ratios are essential financial indicators that evaluate a company’s capacity to generate profit in relation to its revenue, assets, equity, and other financial factors. Here's a detailed explanation of the most important profitability ratios for analysing a company's profitability:
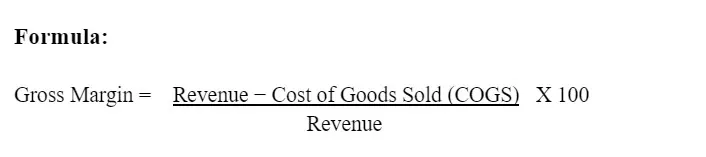
Gross margin:
Gross margin represents the percentage of revenue that surpasses the cost of goods sold (COGS). It indicates how efficiently a company produces or delivers its goods and services relative to its direct production costs.
Formula:
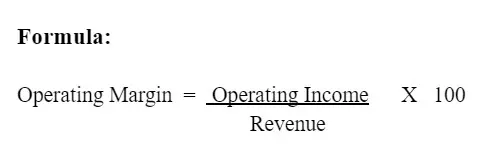
Operating margin:
Operating margin measures the percentage of revenue that remains after deducting operating expenses, such as wages, rent, and utilities, but before interest and taxes. It reflects the efficiency of a company’s core business operations.
Formula:
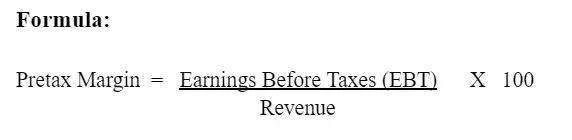
Pretax margin:
The pretax margin reflects a company’s profitability before taxes. It indicates how profitable the company is from its core operations and investments before government obligations are taken into account.
Formula:
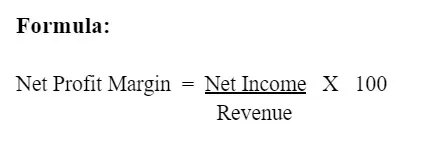
Net profit margin:
Net profit margin is the percentage of revenue that remains as profit after all expenses, taxes, and interest are deducted. It is the most comprehensive measure of a company’s profitability.
Formula:
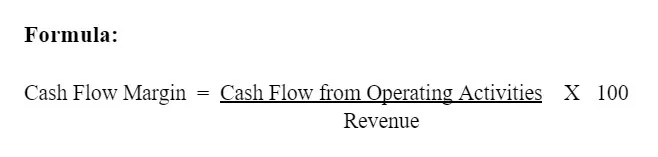
Cash flow margin:
Cash flow margin measures how effectively a company converts its sales into actual cash flow, which is critical for maintaining liquidity and sustaining operations. It shows the percentage of revenue that translates into cash from operations.
Formula:
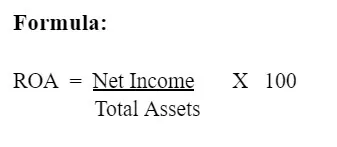
Return on assets (ROA):
Return on assets (ROA) measures how efficiently a company uses its assets to generate profit. It reflects the company's profitability in relation to its total assets.
Formula:
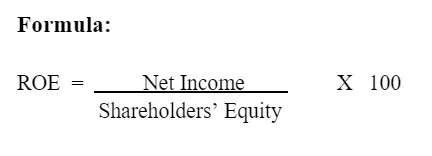
Return on equity (ROE):
Return on equity (ROE) measures the return that shareholders receive on their investment in the company. It is a key indicator of financial performance from an investor’s perspective.
Formula:
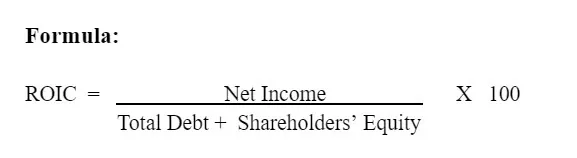
Return on invested capital (ROIC):
Return on invested capital (ROIC) measures how well a company is using its capital—both debt and equity—to generate returns. It shows whether the company is generating returns that exceed its cost of capital.
Formula:
Steps to Check the Profitability of a Company
Below are the key steps to check the profitability of a company:
Step 1: Gather Financial Data:
Start by collecting key financial statements, including the income statement, balance sheet, and cash flow statement. These documents provide essential information about revenue, expenses, assets, and liabilities.
Step 2: Calculate Break-even Point:
Identify the break-even point at which total revenue matches total costs. This helps you understand how many units need to be sold or how much revenue is required to cover both fixed and variable costs.
Step 3: Analyse Profitability Ratios:
Use profitability ratios to evaluate how effectively the company generates profit. Key ratios, such as gross margin and net profit margin, help identify financial trends and assess resource management.
Step 4: Compare with Benchmarks:
Compare your profitability ratios with industry benchmarks or competitors to assess your company’s performance. This comparison offers valuable insight and helps pinpoint areas that may need improvement.
Advantages of Profitability Analysis
Improved Financial Insight: Profitability analysis provides a clear picture of how well a company is performing financially by measuring its ability to generate profit relative to various financial metrics.
Enhanced Cost Management: By identifying the costs associated with different products, services, or business segments, profitability analysis helps businesses manage and reduce expenses more effectively.
Strategic Planning and Growth: Profitability analysis supports strategic planning by highlighting which areas of the business are most profitable and which are underperforming.
Increased Profit Margins: Understanding the profitability of different products or services enables businesses to optimise their pricing strategies and improve profit margins.
Better Financial Health Monitoring: Regular profitability analysis helps in assessing the financial health of a company and ensuring its long-term sustainability.
Enhanced Competitive Advantage: By analysing profitability, businesses can gain insights into their competitive positioning and make adjustments to improve their market stance.
Risk Management: Profitability analysis aids in identifying and managing financial risks by highlighting potential problem areas before they become critical issues.
The Bottom Line
In the dynamic world of business and the stock market, where every decision can impact potential profits, mastering profitability analysis is not just an option but a necessity. This powerful tool equips companies with the insights needed to navigate financial challenges, optimise operations, and seize growth opportunities. By analysing how companies generate profits and comparing their performance to industry benchmarks, investors can make more informed decisions about which stocks to buy and sell, potentially optimising their returns.
Embrace profitability analysis as a cornerstone of your business and investment strategy, and watch as it transforms financial data into actionable insights that fuel sustainable growth and enduring success.
FAQs:-
What does the profitability ratio indicate?
Profitability ratios indicate how efficiently a company is generating profits relative to its revenue, assets, equity, or other financial metrics. They help stakeholders assess the company's financial performance.
How do gross margin and net profit margin differ?
Gross margin measures the percentage of revenue that exceeds the cost of goods sold, while net profit margin reflects the percentage of revenue left after all expenses, taxes, and interest have been deducted.
Related Blog
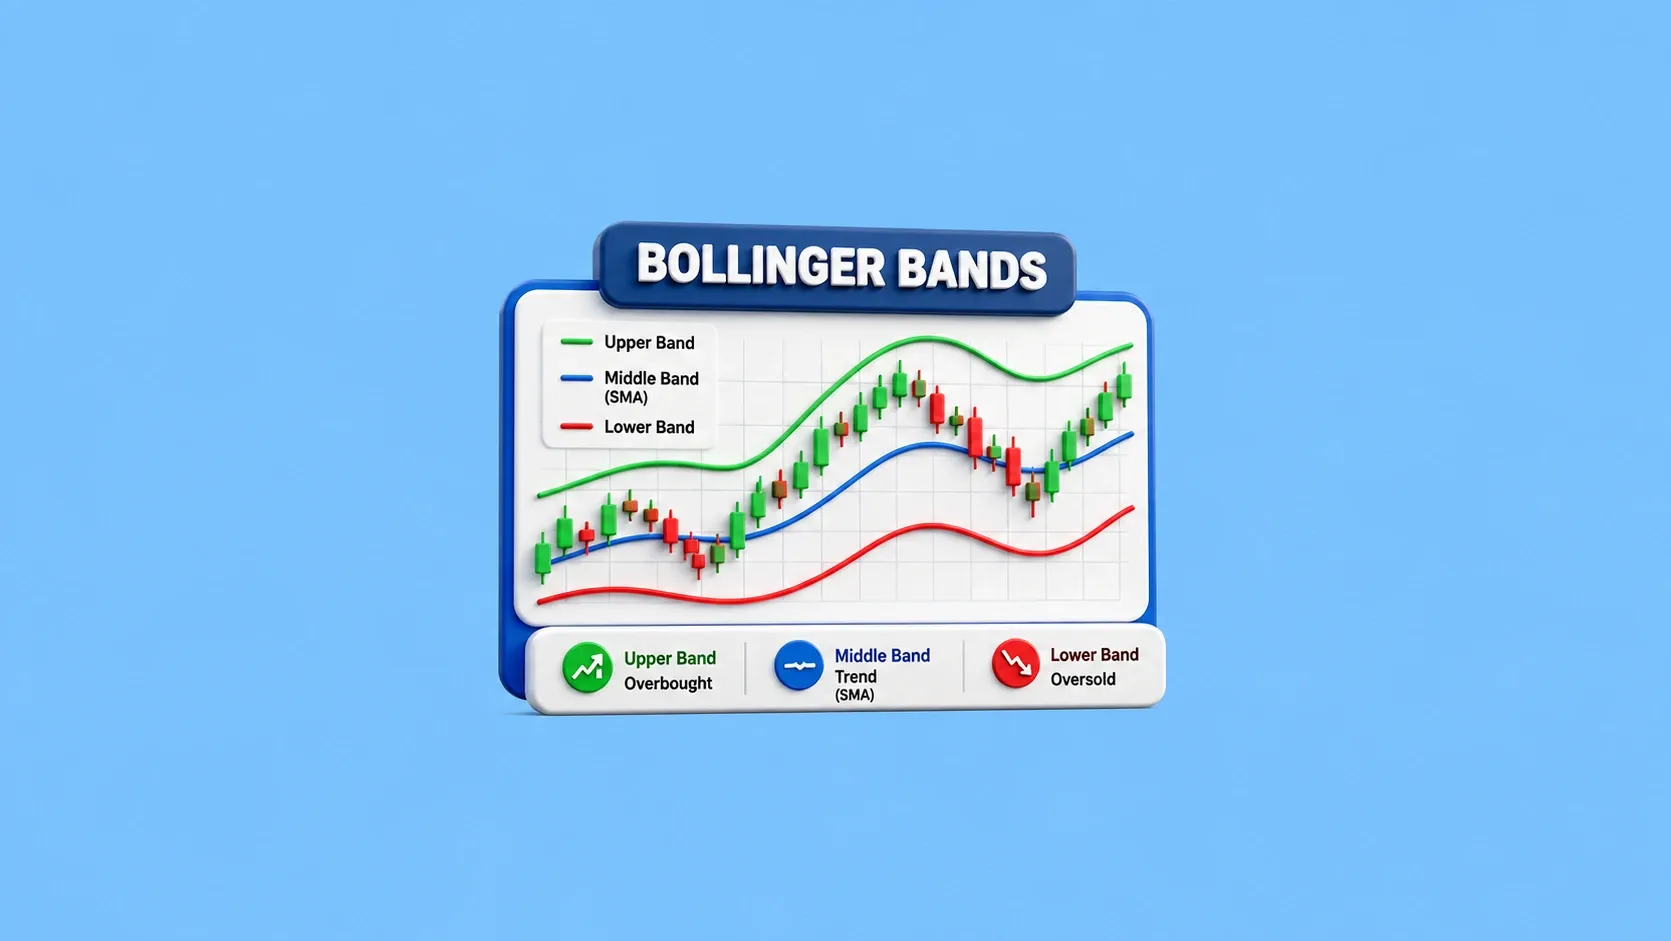
The Bollinger Bands indicator is a popular technical analysis tool that helps traders measure market volatility and identify potential trading opportunities. Whether you're trading Stocks, Nifty, or derivatives, understanding what Bollinger Bands are can help you analyse price movements more effectively. In this guide, you’ll learn how Bollinger Bands work, how they are calculated, popular trading strategies, and how to apply them using Choice FinX. What are Bollinger Bands? The Bollinger Ba
27 July 2026

FII DII Data Today 27th July 2026 CATEGORY DATE BUY VALUE (₹ Crores) SELL VALUE (₹ Crores) NET VALUE (₹ Crores) DII 27-July-2026 14,423.91 12,137.80 2,286.11 FII 27-July-2026 11,440.52 13,113.48 -1,672.96 What are FII and DII in the Stock Market Foreign Institutional Investors (FIIs) invest in the Indian stock market from international markets, while Domestic Institutional Investors (DIIs) include mutual funds and institutional bodies operating from India. fii dii data helps tra
26 July 2026

Nifty Prediction For Tomorrow The Nifty 50 tomorrow market prediction indicates a Sideways to Bullish trend. The range is between 23800 and 24250, with support at 23800-23850 and resistance at 24200-24250. Traders should monitor these crucial levels closely for potential market shifts. Nifty 50 Share Price * Nifty Support: 23800-23850 * Nifty Resistance: 24200-24250 * BIAS: Sideways to Bullish Nifty Range 23800 24250 Indian equity benchmark Nifty 50 staged a strong recovery, e
26 July 2026
Made for Traders.
Trusted by Investors.
Download FinX — trade confidently, invest
smarter, track everything.

Table of Contents
- What is Profit?
- What is the Profitability Analysis of a Company?
- Importance of Profitability Analysis
- Key Elements of Profitability Analysis
- Important Profitability Ratios for Company Profitability Analysis
- Steps to Check the Profitability of a Company
- Advantages of Profitability Analysis
- The Bottom Line
- FAQs:-