
If you’ve ever tried to evaluate whether a stock is worth buying, you have likely come across the term EPS. It’s one of the most widely used indicators of a company’s profitability and plays a big role in stock valuation. But what does it really mean, and why is it so important?
This blog aims to break down EPS meaning, its formula, different types, how it’s calculated, and why it matters to investors. We’ll also look at its benefits, limitations, and key factors that influence it.
What is The Definition of Earnings Per Share
The EPS full form in share market is Earnings Per Share. It represents the portion of a company’s net profit allocated to each outstanding share of its common stock. In simple terms, EPS tells you how much a company makes for each share you own.
Higher EPS often indicates higher profitability, making such firms attractive to investors. For example, high EPS stocks refer to companies generating consistent profits and offering strong returns.
How is EPS Calculated?
The EPS formula on how to calculate earnings per share
EPS = (Net Income - Preferred Dividends) / Weighted Average Outstanding Shares
Where,
- Net Income: Profit after all expenses, interest, and taxes.
- Preferred dividends: Dividends paid to preferred shareholders (deducted since EPS only considers common shareholders).
- Weighted Average Share: Adjusted for any share buybacks or issuances during the period.
Earning Per Share (EPS) Example:
Imagine Company XYZ Ltd. has the following financial details for the current year:
- Net Income: ₹10,00,000
- Preferred Dividends: ₹2,00,000
- Weighted Average Common Shares Outstanding: 4,00,000 shares
Now, applying the EPS formula:
EPS = (Net Income - Preferred Dividends) / Weighted Average Outstanding Shares
EPS = (₹10,00,000 - ₹2,00,000) / 4,00,000
= ₹8,00,000 / 4,00,000
= ₹2 per share
This means every common share of XYZ Ltd. earned ₹2 during the reporting period. Investors can now use this figure, along with ratios like the P/E ratio, to judge whether XYZ’s stock is fairly valued compared to peers.
Why is Earnings Per Share Important?
Earnings Per Share (EPS) is one of the most important indicators of a company’s financial health. Here’s why EPS matters:
1. Measure of Profitability: EPS shows how effectively a company is converting its earnings into returns for shareholders. A company with higher EPS is considered to be more profitable.
2. Helps in Stock Valuation: EPS is a key input in the Price-to-Earnings (P/E) ratio, which helps investors decide if a stock is overvalued, undervalued, or fairly priced. Without EPS, this ratio cannot be calculated.
3. Comparison Across Companies: Since EPS is standardised, it allows investors to compare companies within the same industry and identify high EPS stocks that may deliver better returns.
4. Guides Investment Decisions: Investors often use EBIT and EPS analysis to understand how financing decisions (like debt vs. equity) affect profitability per share. This makes EPS a critical tool in evaluating long-term prospects.
5. Indicator of Growth: Consistently rising EPS over the years signals financial strength, good management, and growth potential, which is attractive to both retail and institutional investors.
Types of Earnings Per Share (EPS)
Companies report different forms of Earnings Per Share (EPS) depending on adjustments, reporting requirements, or investor needs. Let’s explore the types of EPS:
Reported EPS (GAAP EPS):
This is the standard EPS figure most commonly reported in financial statements. It is derived by dividing a company’s net income by the weighted average number of outstanding shares. Reported EPS provides a baseline measure of profitability as per accounting rules.
Ongoing EPS (Pro Forma EPS):
Pro Forma EPS removes the impact of unusual or non-recurring items, such as restructuring costs or one-time gains. This version helps investors focus on the company’s core operating performance without distortions.
Retained EPS:
Retained EPS is calculated by deducting dividends distributed to shareholders from the company’s net income. It indicates the portion of earnings reinvested back into the business for growth and expansion.
Cash EPS:
Cash EPS is based on a company’s actual cash flow from operations rather than accounting profits. It is computed by dividing operating cash flow by the number of shares outstanding, giving investors insight into the firm’s true cash-generating ability.
Book Value Per Share (BVPS):
BVPS is obtained by dividing the book value of shareholders’ equity by the number of outstanding shares. It represents the per-share value of a company based on its net assets, offering a more conservative measure of value than market price.
Benefits and Limitations of EPS
While EPS is one of the most widely used indicators in stock analysis, it has both strengths and weaknesses. Let’s take a look at both EPS advantages and limitations:
Benefits of EPS
- Simple measure of profitability: EPS provides a straightforward way to see how much profit a company generates per share.
- Comparison tool: It allows investors to compare companies within the same sector and identify potential high EPS stocks.
- Valuation support: EPS is essential for ratios like the P/E ratio, which helps in determining whether a stock is overvalued or undervalued.
- Growth indicator: A consistently rising EPS signals financial health and good management practices.
- Decision-making tool: EPS is often used in EBIT and EPS analysis to understand how financing decisions affect shareholder returns.
Limitations of EPS
- Ignores debt and cash flow: A company with high debt may show good EPS, but could still be financially risky.
- Influenced by share buybacks: Reducing the number of outstanding shares can artificially boost EPS without real growth in profits.
- Accounting adjustments: EPS can be affected by non-cash items like depreciation or one-time gains/losses, which may not reflect actual performance.
- Not industry-adjusted: A “good EPS” varies across sectors, so comparing companies from different industries may give misleading results.
- Short-term focus: EPS shows past profitability but doesn’t guarantee future performance or growth potential.
What are the Factors that Impact EPS?
The Earnings Per Share (EPS) of a company doesn’t move in isolation; it is influenced by several internal and external factors. Investors should understand these drivers to interpret EPS correctly.
1. Revenue Growth: Higher sales typically increase net income, which directly improves EPS. Conversely, declining revenue lowers profitability and reduces EPS.
2. Operating Expenses: Rising costs such as salaries, raw materials, or overheads eat into profits, which in turn lowers EPS. Companies with efficient cost control usually maintain stronger EPS.
3. Interest and Taxes: High interest payments on debt or rising tax liabilities reduce net income, leading to a lower EPS.
4. Share Count Changes: Share buybacks reduce the number of outstanding shares, often boosting EPS even if profits remain flat. Issuing new shares increases the share base, which can dilute EPS.
5. Economic Conditions: Market slowdowns, inflation, or changes in consumer demand affect revenue and profitability, thereby impacting EPS.
6. Extraordinary Items: One-time gains (like selling an asset) or losses (like legal settlements) can temporarily inflate or deflate EPS, making it less reliable.
7. Accounting Policies: Changes in accounting methods (for depreciation, inventory valuation, etc.) can alter reported net income and affect EPS without any real change in operations.
Basic EPS vs. Diluted EPS
When companies report Earnings Per Share (EPS), they often provide two versions: Basic EPS and Diluted EPS. Both are useful, but they tell slightly different stories about a company’s profitability.
1. Basic EPS:
- Definition: Basic EPS measures the profit available to each existing common share.
- Purpose: It provides a straightforward view of profitability per share based only on current shares in circulation.
2. Diluted EPS:
- Definition: Diluted EPS factors in all potential shares that could be created if stock options, convertible bonds, or warrants were exercised.
- Purpose: It shows a “worst-case scenario” of earnings per share if all possible shares were issued, giving a more conservative measure of profitability.
Key Differences
| Aspect | Basic EPS | Diluted EPS |
|---|---|---|
| Share Count | Considers only existing common shares | Considers existing + potential convertible shares |
| Profitability Shown | Higher (since fewer shares are considered) | Lower (since more shares dilute the earnings) |
| Usefulness | Best for a simple view of profitability | Better for risk assessment and conservative analysis |
| Complexity | Simple calculation | More detailed and includes potential dilution |
How is Basic vs. Diluted EPS Calculated?
Both Basic EPS and Diluted EPS use the company’s net income, but the difference lies in how the number of shares is counted. Let’s break it down:
1. Basic EPS Calculation:
Formula:
Basic EPS = (Net Income - Preferred Dividends) / Weighted Average Outstanding Shares
Example:
- Net Income = ₹50,00,000
- Preferred Dividends = ₹5,00,000
- Weighted Average Shares Outstanding = 10,00,000 shares
Basic EPS = (₹50,00,000 - ₹5,00,000) / 10,00,000
= ₹4.5 per share
2. Diluted EPS Calculation:
Formula:
Diluted EPS = (Net Income - Preferred Dividends) / (Weighted Average Shares + Convertible Securities)
Example:
- Net Income = ₹50,00,000
- Preferred Dividends = ₹5,00,000
- Weighted Average Shares Outstanding = 10,00,000 shares
- Potential Convertible Shares (options, warrants, bonds) = 2,00,000 shares
Diluted EPS = (₹50,00,000 - ₹5,00,000) / (10,00,000 + 2,00,000)
= ₹45,00,000 / 12,00,00
= ₹3.75 per share
Key Takeaways
- The EPS full form is Earnings Per Share. It represents the profit earned per outstanding share of common stock.
- The EPS formula is: EPS = (Net Income - Preferred Dividends) / Weighted Average Outstanding Shares.
- EPS is crucial for stock analysis and is often used with the P/E ratio to assess valuation.
- There are different types of EPS: Reported, Pro Forma, Cash, Basic, and Diluted EPS, each offering a unique perspective on profitability.
- Basic EPS gives a straightforward figure, while Diluted EPS shows a more conservative estimate by including potential convertible shares.
- EPS can be influenced by several factors, such as revenue growth, expenses, taxes, share buybacks, or dilution.
- A consistently growing EPS usually indicates financial strength, but it should never be analysed in isolation.
- Investors should combine EPS with other metrics like revenue growth, debt ratios, and cash flow before making decisions.
Concluding Thoughts
Understanding what is EPS and how it’s calculated is crucial for every investor. While EPS gives a snapshot of profitability, it’s not the sole factor in investment decisions. A high EPS doesn’t always mean a stock is a good buy; it must be analysed in the context of industry trends, company strategy, and broader market conditions.
FAQs
1. What is EPS in simple words?
EPS, or Earnings Per Share, is the portion of a company’s profit assigned to each share of stock.
2. How to calculate EPS?
Use the formula: (Net Income – Preferred Dividends) ÷ Weighted Average Shares.
3. What is the difference between basic EPS and diluted EPS?
Basic EPS considers only existing shares, while diluted EPS includes the impact of potential convertible shares.
4. Why is EPS important for investors?
It shows profitability per share and helps evaluate stock value using ratios like P/E.
5. What is EBIT and EPS analysis?
It’s a method that studies the relationship between a company’s earnings before interest and tax (EBIT) and its EPS to understand how financing decisions impact shareholder returns.
Related Blog
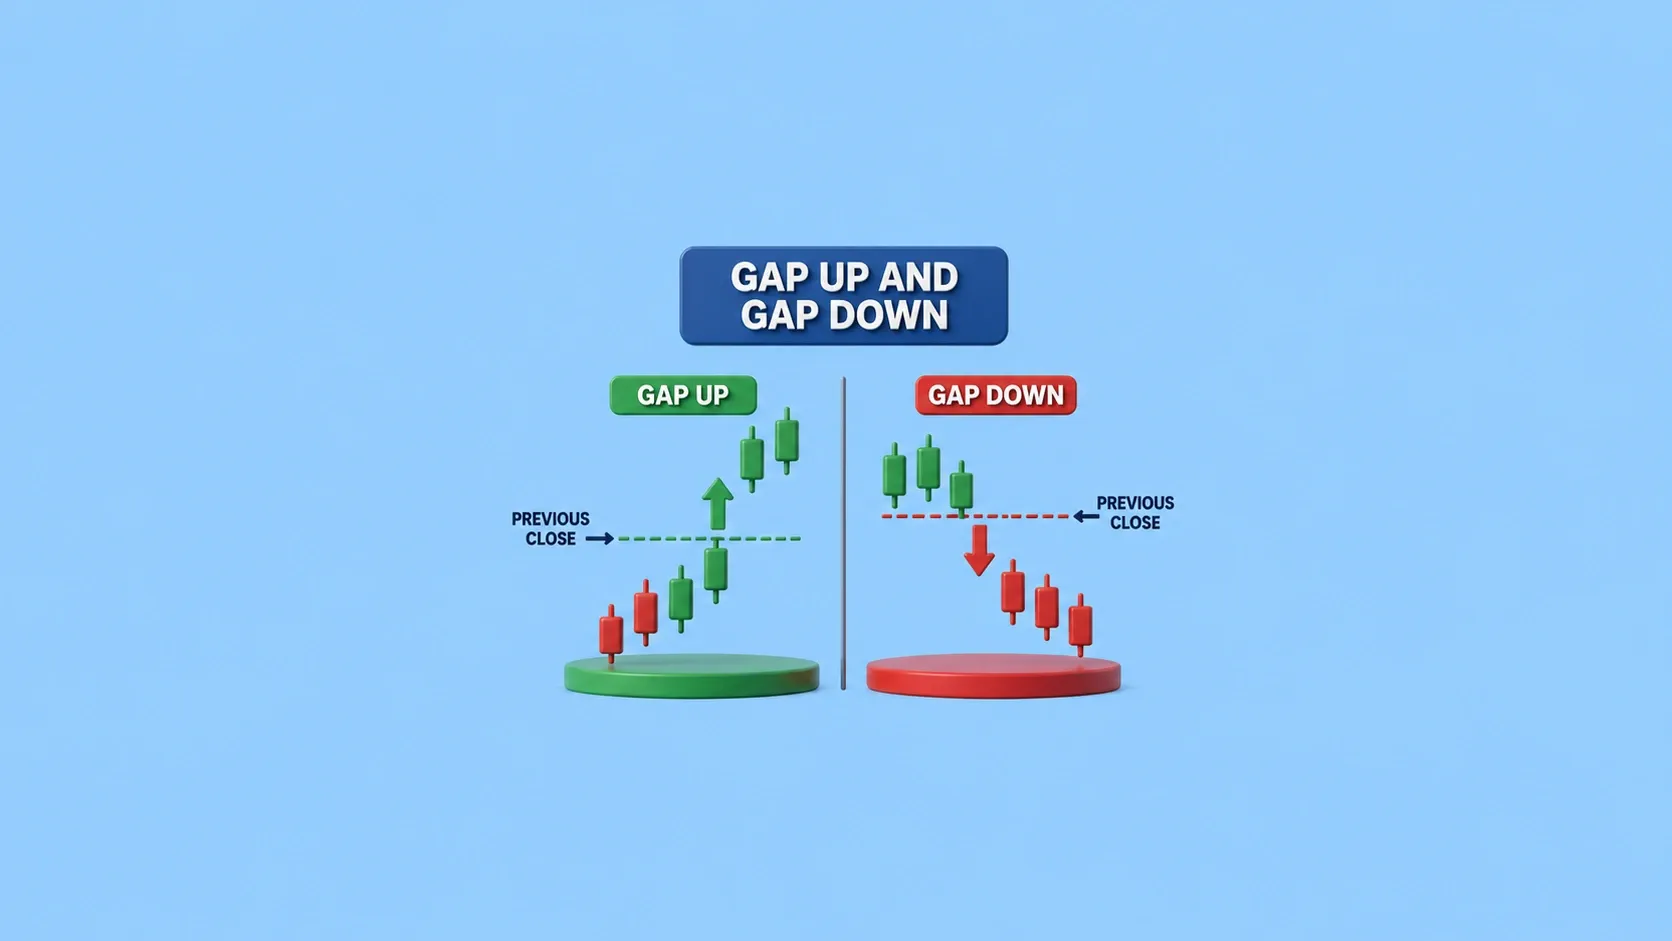
Have you ever opened your trading app and noticed that a stock or the Nifty 50 opened significantly higher or lower than its previous day's closing price? This price difference is known as a gap up and a gap down, and it often reflects a sudden change in market sentiment caused by overnight events. Whether you're an intraday trader or a beginner, understanding what gap up and gap down are can help you make better trading decisions. These price gaps are often triggered by overnight events such a
29 July 2026

Keeping an eye on the stock market throughout trading hours isn't always possible. But that doesn't mean you have to sit out until the next trading day to act on your investment decisions. This is where the After- Market Order (AMO) comes in, allowing you to place your trades even when the market is closed. In this blog, we'll break down what after-market orders are, how they work, their key characteristics, benefits and limitations, and the different types available to investors. What is An
29 July 2026

FII DII Data Today 29th July 2026 CATEGORY DATE BUY VALUE (₹ Crores) SELL VALUE (₹ Crores) NET VALUE (₹ Crores) DII 29-July-2026 16,187.74 15,136.81 1,050.93 FII 29-July-2026 16,352.31 13,472.38 2,879.93 What are FII and DII in the Stock Market Foreign Institutional Investors (FIIs) invest in the Indian stock market from international markets, while Domestic Institutional Investors (DIIs) include mutual funds and institutional bodies operating from India. fii dii data helps trac
28 July 2026
Made for Traders.
Trusted by Investors.
Download FinX — trade confidently, invest
smarter, track everything.

Table of Contents
- What is The Definition of Earnings Per Share
- How is EPS Calculated?
- Why is Earnings Per Share Important?
- Types of Earnings Per Share (EPS)
- Benefits and Limitations of EPS
- Benefits of EPS
- Limitations of EPS
- What are the Factors that Impact EPS?
- Basic EPS vs. Diluted EPS
- Key Differences
- How is Basic vs. Diluted EPS Calculated?
- Key Takeaways
- Concluding Thoughts
- FAQs