
Feeling lost between a company’s financial report and a price chart? Understanding the difference between fundamental and technical analysis is one of the most important steps in becoming a confident investor. These two approaches help you figure out what to buy, when to buy, and why prices behave the way they do.
This guide breaks down what is fundamental analysis, what is technical analysis, their differences, strengths, and weaknesses, and how to combine them for smarter decision-making.
What Is Fundamental Analysis?
Fundamental analysis is a method used to determine a stock’s true or intrinsic value by studying the company’s financial health, business performance, competitive position, and the overall economic environment. Instead of focusing on short-term market noise, this approach focuses on a business’s long-term strength and potential.
Think of it like evaluating a car's true value by checking its engine, mileage, service history, and condition, rather than the sticker price at the dealership. Fundamental analysis helps you determine whether a stock is undervalued, fairly valued, or overvalued by assessing what the company is truly worth.
What Fundamental Analysis Focuses On?
Fundamental analysis aims to answer a single core question: “What should this company be worth based on its actual performance?”
Investors use this approach because while stock prices may fluctuate due to emotions or market sentiment, a company’s fundamentals reveal its long-term value.
Key Components of Fundamental Analysis
1. Financial Statements:
- Income Statement: Shows revenue, expenses, and profits, like a company’s report card.
- Balance Sheet: Lists what the company owns (assets) and owes (liabilities).
- Cash Flow Statement: Tracks cash inflows and outflows, similar to reviewing your bank activity.
2. Business Model & Competitive Advantage: Understanding how the company makes money and what sets it apart from competitors.
3. Industry & Economic Conditions: Factors like sector growth, market demand, interest rates, inflation, and GDP trends influence a company’s performance.
4. Management Quality: Experienced leadership and strong governance often lead to long-term growth.Common Tools Used in Fundamental Analysis
- P/E Ratio (Price-to-Earnings): Shows how much investors are willing to pay for every dollar of earnings.
- P/B Ratio (Price-to-Book): Compares the stock price to the company’s net assets.
- EPS (Earnings Per Share): Measures profit per share.
- DCF (Discounted Cash Flow): A valuation method that estimates today’s value of future cash flows.
- Economic Reports: Such as inflation data, employment numbers, and GDP growth.
What is Technical Analysis?
Technical analysis is a method of evaluating stocks by studying price movements, chart patterns, and trading volume, not the company’s financials. Instead of asking “Is this company fundamentally strong?”, technical analysts ask: “Based on current price behaviour, where is the stock likely to move next?”
Think of technical analysis like forecasting the weather. You look at patterns, signals, and historical conditions to estimate what might happen next. While you can’t predict the market with certainty, technical tools help traders identify probabilities, trends, and the best moments to buy or sell.
What Technical Analysis Focuses On?
Technical analysis is built on three core beliefs - market price reflects everything
(all known information, news, fundamentals, and sentiment, is already priced in), prices move in trends (uptrends, downtrends, or sideways trends tend to continue until something shifts), and history repeats itself (human behaviour creates recurring chart patterns).
The goal is to interpret these patterns and signals to make smarter trading decisions.
Key Components of Technical Analysis
- Price Charts: Candlestick, line, and bar charts visualise price movement over time.
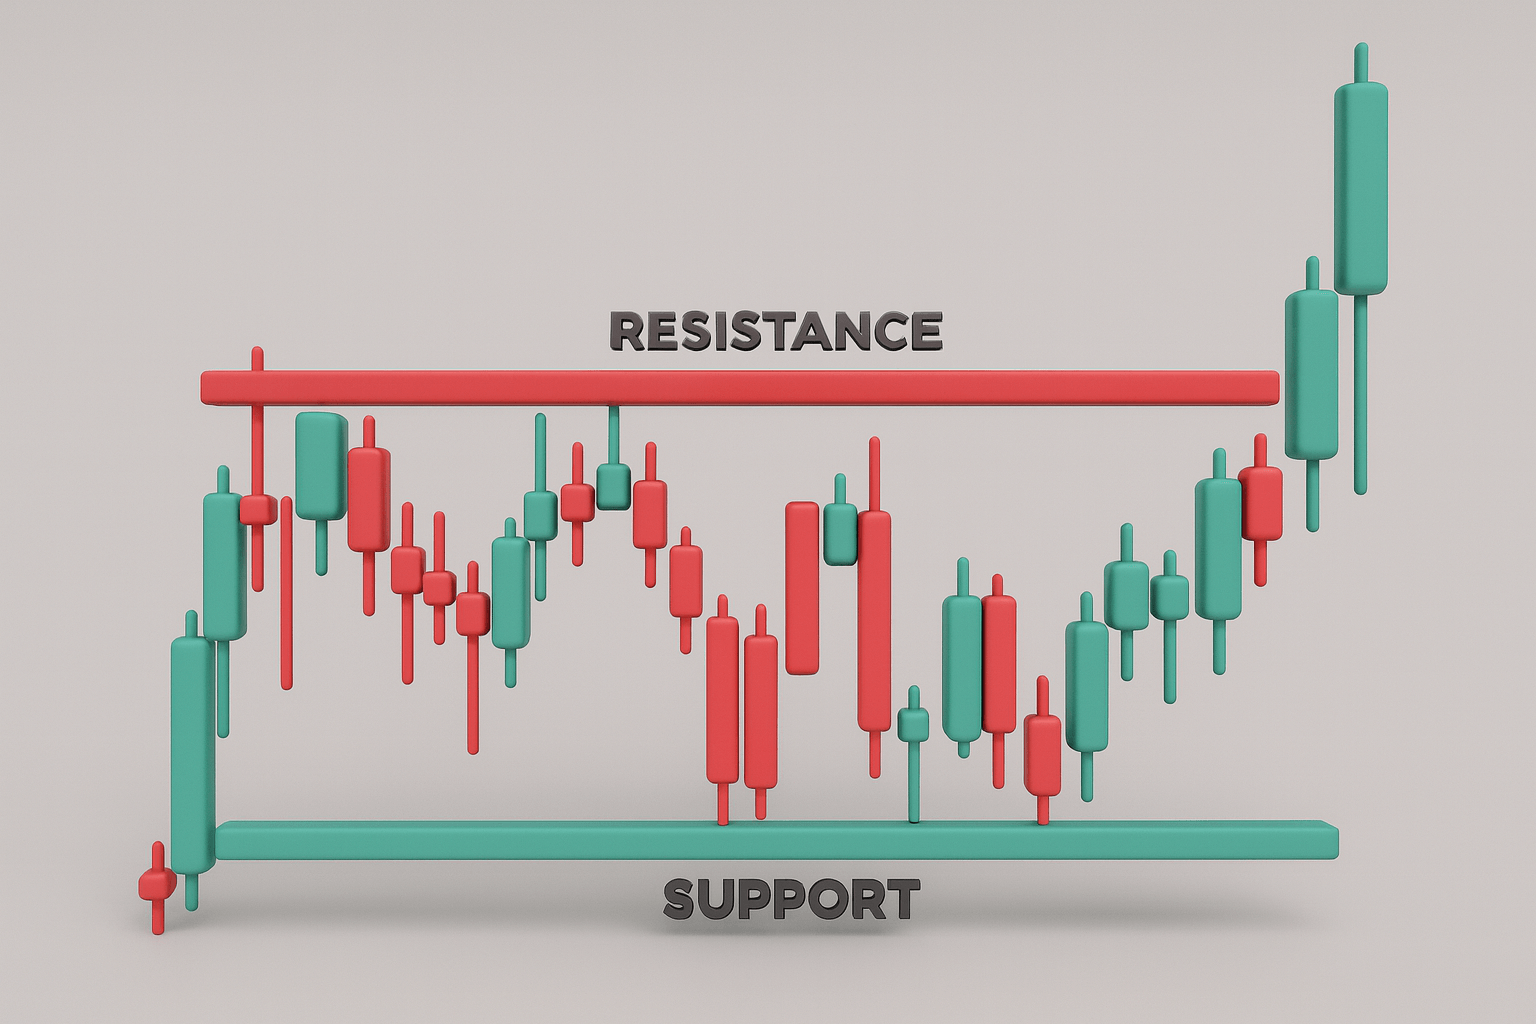
- Support & Resistance: Price levels where buying or selling pressure typically causes reversals.
- Trendlines: Lines that show the direction of the market, upward, downward, or sideways.
- Momentum & Volatility: Measures how fast the price is moving and how much it fluctuates.
- Market Psychology (Crowd Behaviour): Traders react emotionally; patterns form because humans repeat behaviours.
- Chart Patterns: Shapes such as triangles, flags, double tops, and head-and-shoulders that signal potential moves.
Common Tools Used in Technical Analysis
- Moving Averages (MA, EMA): Smooth out price action to identify trends.
- RSI (Relative Strength Index): Signals overbought or oversold conditions.
- MACD (Moving Average Convergence Divergence): Reveals trend direction and momentum changes.
- Fibonacci Retracement: Highlights potential reverse areas.
- Volume Indicators: Confirm whether a trend is strong and likely to continue.
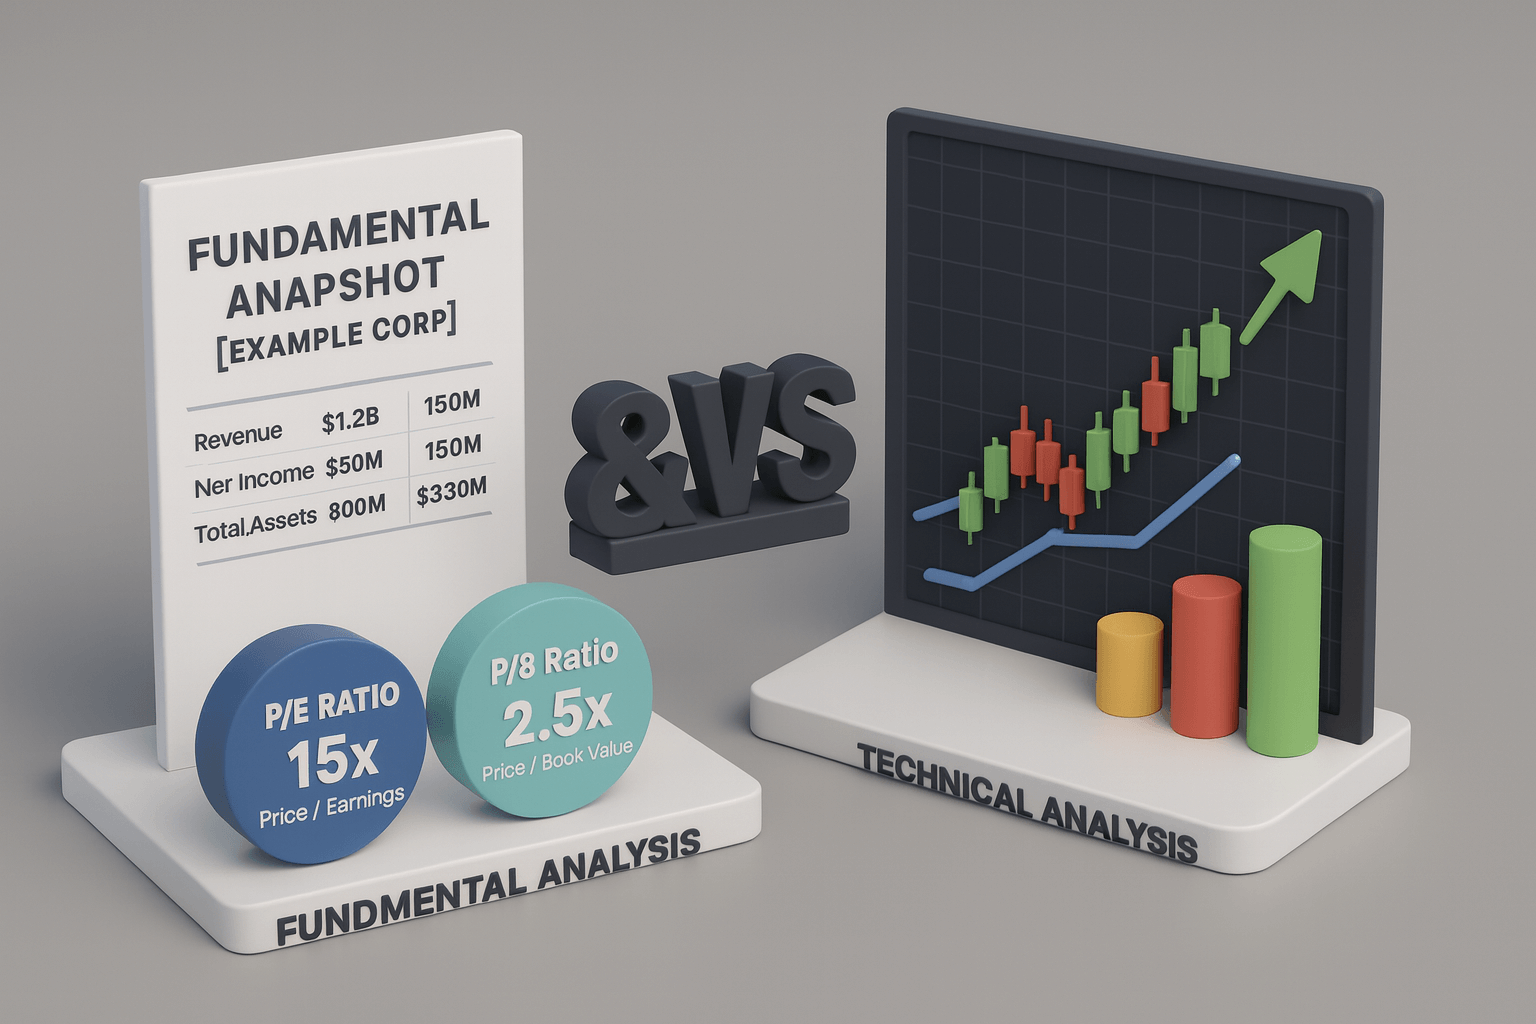
Fundamental Analysis vs Technical Analysis: Key Differences
Understanding the difference between fundamental and technical analysis helps investors choose the method that aligns with their goals. Below is a comparison table summarising how technical and fundamental analysis differ in purpose, approach, and application:
| Feature | Fundamental Analysis | Technical Analysis |
|---|---|---|
| Primary Goal | Determine intrinsic value - what the asset should be worth based on business performance. | Predict price direction and timing using charts, trends, and patterns. |
| What It Studies | The company's financial health, management quality, and economic factors. | Price charts, volume, market trends, and trader psychology. |
| Data Type Used | Financial statements, industry analysis, macroeconomic data. | Historical price data, indicators (RSI, MACD), and chart patterns. |
| Time Horizon | Long-term (months to years). | Short- to medium-term (minutes to weeks). |
| Core Belief | Markets misprice stocks in the short run. | All information is reflected in the price; history repeats itself. |
| Best For | Long-term investors, value seekers, and portfolio building. | Traders, swing traders, day traders, market timers. |
| Output / Result | Estimate of fair value; buy-and-hold decisions. | Trade signals, entry/exit timing. |
| Market View | Business-focused; looks at the company behind the stock. | Behaviour-focused; looks at the price action of the stock. |
Fundamental Analysis: Strengths & Limitations
Let’s take a look at the advantages and disadvantages of fundamental analysis to understand when to rely on it for your investment decision:
| Pros | Cons |
|---|---|
| Helps identify long-term value and strong businesses. | Time-consuming; requires detailed research and analysis. |
| Based on real financial data, not short-term market noise. | Not useful for short-term trading or market timing. |
| Ideal for building diversified, stable portfolios. | Market irrationality can delay price correction, even if the stock is fundamentally strong. |
| Evaluates business quality, competitive advantage, and management strength. | Requires understanding of accounting, finance, and economic concepts. |
| Useful for long-term wealth creation, retirement planning, and value investing. | External factors (regulatory changes, economic shocks) can impact results despite strong fundamentals. |
| Allows investors to estimate a "margin of safety" (buying at a price well below the intrinsic value). | Focuses only on 'Why' to buy, not 'When' to buy. (This emphasises the lack of market timing ability) |
Technical Analysis: Strengths & Limitations
Charts can reveal a lot about market behaviour, but technical analysis isn’t perfect. Here’s a quick look at its strengths and weaknesses.
| Pros | Cons |
|---|---|
| Helps traders identify short-term trends, breakouts, and reversals quickly. | Can generate false signals, especially in volatile or news-driven markets. |
| Works best on highly liquid assets (large-cap stocks, indices, major forex pairs) where high trading volume validates patterns. | Relies heavily on historical price data, which may not predict unexpected events. |
| Offers clear entry and exit signals using indicators and chart patterns. | Over-analysis (“indicator overload’’) can lead to confusing or conflicting signals. |
| Useful for market timing, momentum trading, and active strategies. | Requires experience to interpret charts accurately; beginners may misread patterns. |
| Helps manage risk with stop-loss levels, trendlines, and volatility metrics. | Less effective in sideways/choppy markets, where trends are unclear. |
| It is easy to automate and backtest trading strategies. (Code and test strategies using historical data.) | Ignores the actual financial health of the business. |
Subjectivity: The Hidden Challenge in Both Methods
While both fundamental and technical analysis aim to be objective, they both contain an element of subjectivity that investors must be aware of:
1. Subjectivity in Fundamental Analysis: The true "intrinsic value" calculated by FA is not a fixed number. Valuation models, such as the Discounted Cash Flow (DCF) method, require analysts to make critical assumptions about:
- Future revenue growth rates.
- The appropriate discount rate (cost of capital).
- The long-term terminal growth rate.
Slight changes to these assumptions can drastically alter the final estimated intrinsic value, leading to significant differences between analysts' fair value estimates for the same company.
2. Subjectivity in Technical Analysis: Traders often experience "chart-reading bias." Given the same price chart, different technical analysts may:
- Draw trendlines at slightly different angles or points.
- Interpret a consolidation pattern as a Head and Shoulders (bearish) while another sees it as a Rectangle (continuation).
- Use different indicator settings (e.g., a 10-day vs. a 20-day Moving Average), resulting in conflicting buy/sell signals.
This subjectivity means that patterns can be clearer in hindsight than in real-time.
When Should You Use Each Method?
Choosing between fundamental analysis and technical analysis depends on your investment goals, time horizon, and decision-making style.
Use Fundamental Analysis When:
You care about the true value of a company and want to build long-term wealth.
- You’re investing for the long run (months to years): Ideal for retirement accounts, long-term portfolios, or buying companies you believe will grow over time.
- You want to know whether a stock is undervalued or overvalued: FA helps you determine whether the market price reflects the company’s real worth.
- You prefer a business-first approach: You want to understand revenue, profits, debt, competition, management quality, and industry conditions.
- You’re evaluating stable, proven companies: Mature firms with predictable earnings are best analysed through financial fundamentals.
- You want to invest with high conviction: FA builds a deeper understanding of why you’re buying the stock, helping you stay confident during market swings.
Use Technical Analysis When:
You care more about price movement than company fundamentals and want better timing on entries/exits.
- You’re trading in the short to medium-term: TA is effective for day trading, swing trading, or spotting shorter price cycles.
- You want to identify the best time to buy or sell: Charts help you avoid buying too early or selling too late.
- You believe price reflects market psychology: TA captures investor emotions - fear, greed, hesitation, which often drive short-term trends.
- You’re looking for patterns and momentum signals: Indicators (RSI, MACD, moving averages) help confirm if a trend is strengthening or weakening.
- You want clear, rules-based decisions: TA translates market behaviour into visual setups and signals, making decision-making more systematic.
Use Both (Hybrid Approach) When:
You want the best of both worlds: strong fundamentals + smart timing.
- You’ve found a fundamentally strong company (solid profits, manageable debt, real competitive advantage).
- But you want to avoid buying during a downtrend: TA helps you confirm whether momentum is turning positive before you enter.
- You prefer high conviction and disciplined timing: FA gives you confidence in the business; TA shows you when the market agrees.
- You want to reduce risk while maximising opportunity: A hybrid approach helps you avoid value traps and false chart signals.
Example Hybrid Workflow:
- Identify a great business through FA.
- Wait for a technical signal (a breakout, a price reversal, or a strong volume).
- Enter when fundamentals + charts align.
Conclusion
Understanding the difference between fundamental and technical analysis helps you choose the right strategy for your goals.
If you want to invest for years and focus on business strength, use fundamental analysis. If you wish to trade in the short term and profit from price moves, choose technical analysis. For the best of both worlds, embrace the hybrid approach!
Related Blog

Natural Gas Price Prediction for Next Week (27th July - 31st July 2026) Support 2 Support 1 CMP Resistance 1 Resistance 2 266.50 273 276.50 287.50 297.60 Weekly NYMEX Natural gas futures climbed to around $2.90 per MMBtu, extending their recovery from a two-month low as forecasts for above-normal temperatures through 7 August boosted expectations of stronger cooling demand. Prices also found support from escalating US-Iran tensions, which renewed concerns over Europe's LNG supply sec
25 July 2026

Crude Oil Price Forecast for Next Week (27th July - 31st July 2026) Support 2 Support 1 CMP Resistance 1 Resistance 2 7349 7856 8616 8950 9300 Weekly WTI Crude Oil prices remained volatile, with prices slipping towards $90 per barrel but still ending the week around 10% higher as escalating Middle East tensions fuelled supply concerns. The US launched a 13th consecutive day of strikes on Iran, while President Donald Trump warned of "major military punishment" against Iran and the Hou
25 July 2026

Copper Price Forecast for Next Week (27th July - 31st July 2026) Support 2 Support 1 CMP Resistance 1 Resistance 2 1221.50 1294 1331.80 1360.65 1385 LME copper futures steadied around $13,598 as the market balanced tighter supply against weaker demand signals. In India, MCX copper futures declined on subdued buying from domestic consuming industries, while profit-taking capped earlier gains as concerns over slower demand growth returned. Inventories in LME-registered and Shanghai-mon
25 July 2026
Made for Traders.
Trusted by Investors.
Download FinX — trade confidently, invest
smarter, track everything.

Table of Contents
- What Is Fundamental Analysis?
- Key Components of Fundamental Analysis
- What is Technical Analysis?
- Key Components of Technical Analysis
- Common Tools Used in Technical Analysis
- Fundamental Analysis vs Technical Analysis: Key Differences
- Fundamental Analysis: Strengths & Limitations
- Technical Analysis: Strengths & Limitations
- Subjectivity: The Hidden Challenge in Both Methods
- When Should You Use Each Method?
- Conclusion