What is A Growth Rate?

- Published Date: September 25, 2024
- Updated Date: January 29, 2025
- By Team Choice
A growth rate is a measure of how much a specific variable changes over a set period. It is usually measured or expressed as a percentage. This potential can be either positive or negative, depending on whether the variable’s value is increasing or decreasing. The concept of growth rate is widely used in economics, finance, and business management to assess various metrics.
Growth rates are known to provide valuable insights into the health and trajectory of an economy. Thus, it is widely applied to large economic indicators such as gross domestic product (GDP) or inflation. Additionally, growth rates are used by investors in the financial landscape to analyse the performance of investments or companies.
This article will delve into the details of growth rates in the context of the stock market to help investors or other stakeholders measure the annualised growth of revenue, earnings, or dividends. If you still have not opened a demat account you can open free demat account with Choice.
How to Calculate the Growth Rate?
The growth rate of a variable, such as revenue, earnings, or investment value, is calculated by determining the percentage change between two periods. The basic formula for growth rate is:

Steps to Calculate Growth Rate:
- Identify the Starting (Old) and Ending (New) Values
- Subtract the Old Value from the New Value
- Divide the Result by the Old Value
- Multiply by 100
What is CAGR?
CAGR - Compound Annual Growth Rate is an important indicator used to measure the mean annual growth rate of an investment, company revenues, or other financial metrics over a specific period, assuming the investment has grown consistently. Unlike simple annual growth rates, CAGR smooths out the volatility and provides a more accurate representation of growth over multiple periods.
Formula:

Why is CAGR Important?
- It provides a smooth average rate of growth over a specified period, eliminating fluctuations and seasonal variations.
- It can help investors and business leaders determine whether a company is growing sustainably over the long term, rather than being influenced by short-term spikes or declines.
- It allows for straightforward comparisons between various investments or business units.
- Understanding historical CAGR assists in predicting future performance.
- It is also crucial for portfolio managers to measure the average return of investments over time.
- Businesses can set realistic growth targets based on CAGR.
Types of Growth Rates
In the context of financial markets, growth rates can be broadly classified into two broad categories:
Company and Investment Growth Rates:
Growth rates of companies and investments focus on the financial performance of individual firms or investments. These rates assist investors in evaluating whether to invest in a company and business leaders in assessing their company’s success or failure.
Let’s take a look at some of the key growth metrics under this classification:
Revenue Growth:
Revenue growth refers to the increase in the sales of a company over a specific period. It is considered as most common indicator of how fast a company is expanding its market share and attracting new customers. A higher revenue growth is generally viewed as a positive sign, especially for growth stocks.
Formula:

Example:
A company with ₹50 crores in revenue last year and ₹60 crores this year has a 20% revenue growth rate.
Earnings Growth:
Earnings growth measures how much a company’s net income (profits) has increased over a specific period. It is particularly important because it represents sales performance, cost management, and operational efficiency. Investors seeking to invest in profitable businesses prioritise companies with consistent earnings growth.
Formula:
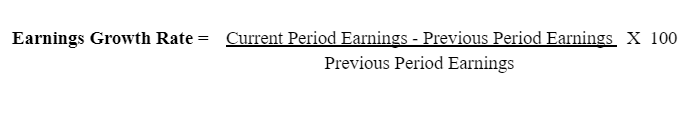
Example:
If a company’s net earnings grew from ₹5 crores to ₹6 crores, the earnings growth rate is 20%.
Dividend Growth:
Dividend growth applies to companies that distribute part of their earnings to shareholders. This metric tracks the increase in dividend payments over time and is often a sign of financial health and stability. Companies with strong dividend growth are attractive to long-term investors seeking steady income streams.
Formula:

Example:
A company increasing its dividend share from ₹5 per share to ₹6 per share would have a 20% dividend growth rate.
Investment Growth:
Investment growth refers to the appreciation of an investment value over time. For instance, an investor buying a stock at ₹100 per share, and seeing the price rise to ₹150 per share over a year, would experience a growth rate of 50%. This metric is vital for measuring the financial return on an investment.
Formula:

Example:
If you have invested ₹1,00,000 in a stock and its value rose to ₹1,20,000, the growth rate would be 20%.
Industry Growth Rates:
While company-specific growth rates represent individual performance, growth rates of an industry provide a broader view of how the entire sector is performing. Industry growth rates are key metrics for investors looking to identify high-potential industries or for businesses looking to enter fast-growing markets.
Industry Revenue Growth:
This metric tracks the overall revenue growth of a particular industry. By analysing the revenue trends across a sector, investors and business owners can determine which industries are expanding the most and offering the most growth potential.
Market Size Growth:
This growth rate reflects the expansion of an industry’s overall market size, including the number of businesses, customers, and total market value. For businesses looking to enter new industries, a growing market size is a positive indicator of future opportunities.
Global or Regional Growth Trends:
Certain industries may grow faster in specific regions than others. For example, the technology industry may experience faster growth in the U.S. or China compared to other regions. Understanding these regional differences allows companies and investors to target markets with the highest growth potential.
Sector-Specific Trends:
Industry growth can also be segmented by trends within the sector. For instance, in the healthcare industry, telemedicine might grow faster than in other areas like medical devices. Tracking these trends can help investors pinpoint the most promising sub-sectors.
Example of a Growth Rate:
Let’s explore a practical example of how to calculate and interpret the growth rate for a small business, like a tea shop, to help you understand the concept more clearly.
Imagine a small tea shop that began its business with a revenue of ₹10 lakhs in its first year and grew to ₹15 lakhs by the second year. Let’s calculate the growth rate of this tea shop to assess how well the business is performing.
In the first year, the tea shop earned ₹10 lakhs in revenue
In the second year, the shop’s revenue increased by ₹15 lakhs
Apply the formula:

The tea shop experienced a 50% growth rate in its revenue from year one to year two. This indicates a positive trend, suggesting that the shop has either:
- Attracted more customers,
- Increased the average order value, or
- Introduced new products like speciality teas or snacks, which helped boost overall revenue
Let's delve into what might have driven this impressive growth:
- New Products: The tea shop may have introduced new items, such as premium teas, snacks, or tea-related accessories, which attracted more customers and boosted sales.
- Increased Pricing: The shop could have adjusted its pricing slightly due to higher demand, without losing customers, resulting in higher overall revenue.
- More Foot Traffic: The tea shop might have improved its location visibility, participated in community events, or run promotions that brought in more customers.
- Better Customer Experience: Positive word-of-mouth from satisfied customers might have drawn new customers, helping the business grow naturally.
If the tea shop plans to continue its expansion, it can estimate long-term growth using CAGR (Compound Annual Growth Rate). Suppose the tea shop forecasts revenue to reach ₹30 lakhs by year five. CAGR can be calculated using the formula:

- Ending Value = ₹30 lakhs
- Beginning Value = ₹10 lakhs
- Number of Years = 5

This means the tea shop would grow at an average rate of 24.57% per year over the next five years, assuming steady growth.
How to Analyse Growth Rates?
When analysing growth rates, it’s important to not only understand how much a company’s revenue or profits are increasing but also why this growth is happening and whether it is sustainable. Let’s explore some of the key methods to analyse growth rates effectively:
Acquisitions of Other Companies:
Acquisitions are a significant factor contributing to a company’s growth rate. When a business acquires another company, it can immediately boost its revenue, market share, and customer base. This can result in a spike in revenue growth, but it’s essential to evaluate whether this growth is organic or driven by the acquisition
Things to Consider: Analysts should differentiate between organic growth (increased sales or profitability from core operations) and growth due to acquisitions. While acquisitions can deliver quick growth, they often come with integration challenges and costs.
Selling New Goods and Services:
Introducing new products or services can be a major driver of a company's growth. Companies that innovate and diversify their product lines are often able to capture new customers and expand into untapped markets. This type of growth is usually seen as sustainable because it reflects the company’s ability to innovate and meet market demand.
Things to Consider: When analysing growth based on new product launches, look for evidence of market demand, product differentiation, and the company’s ability to scale these offerings. Consider whether the company’s core customers are purchasing the new products or if the company is expanding into entirely new markets.
Raising Prices of the Goods/Services:
Another way companies increase their revenue is by raising the prices of their existing products or services. If a company has built a strong brand or offers unique products, it can increase prices without losing significant market share. However, this strategy must be carefully managed to avoid losing customers.
Things to Consider: It’s important to analyse whether the price hikes are sustainable and whether they will negatively impact demand. Also, consider the company’s competitive positioning — can it maintain its customer base at higher price points?
Computing Revenue Growth:
Revenue growth is one of the most basic and essential growth metrics for analysing company performance. It shows how much the company’s sales have increased from one period to the next. A high revenue growth rate often indicates strong market demand, effective marketing, or successful expansion into new markets.
Things to Consider: When analysing revenue growth, it’s important to break it down into components: Is the growth coming from increased sales volume, higher prices, or new markets? Also, ensure that the revenue growth is consistent over multiple periods and not driven by one-time events like promotions or short-term market trends.
Conclusion
Understanding and calculating a company’s growth rate is crucial for investors and business leaders alike. Whether through acquisitions, the introduction of new products, or strategic price increases, companies continually strive to improve their revenue and profit growth.
Analysing growth rates in the context of both the company and the industry is essential for making informed decisions about investments and business strategies. Investors should focus on growth stocks with consistently high growth rates, as these companies have strong potential for long-term profitability.
Recommended for you

Crude Oil Price Forecast for Next Week

Alan Scott Industries Ltd Right Issue 2025

Lloyds Engineering Works Ltd Right Issue 2025